



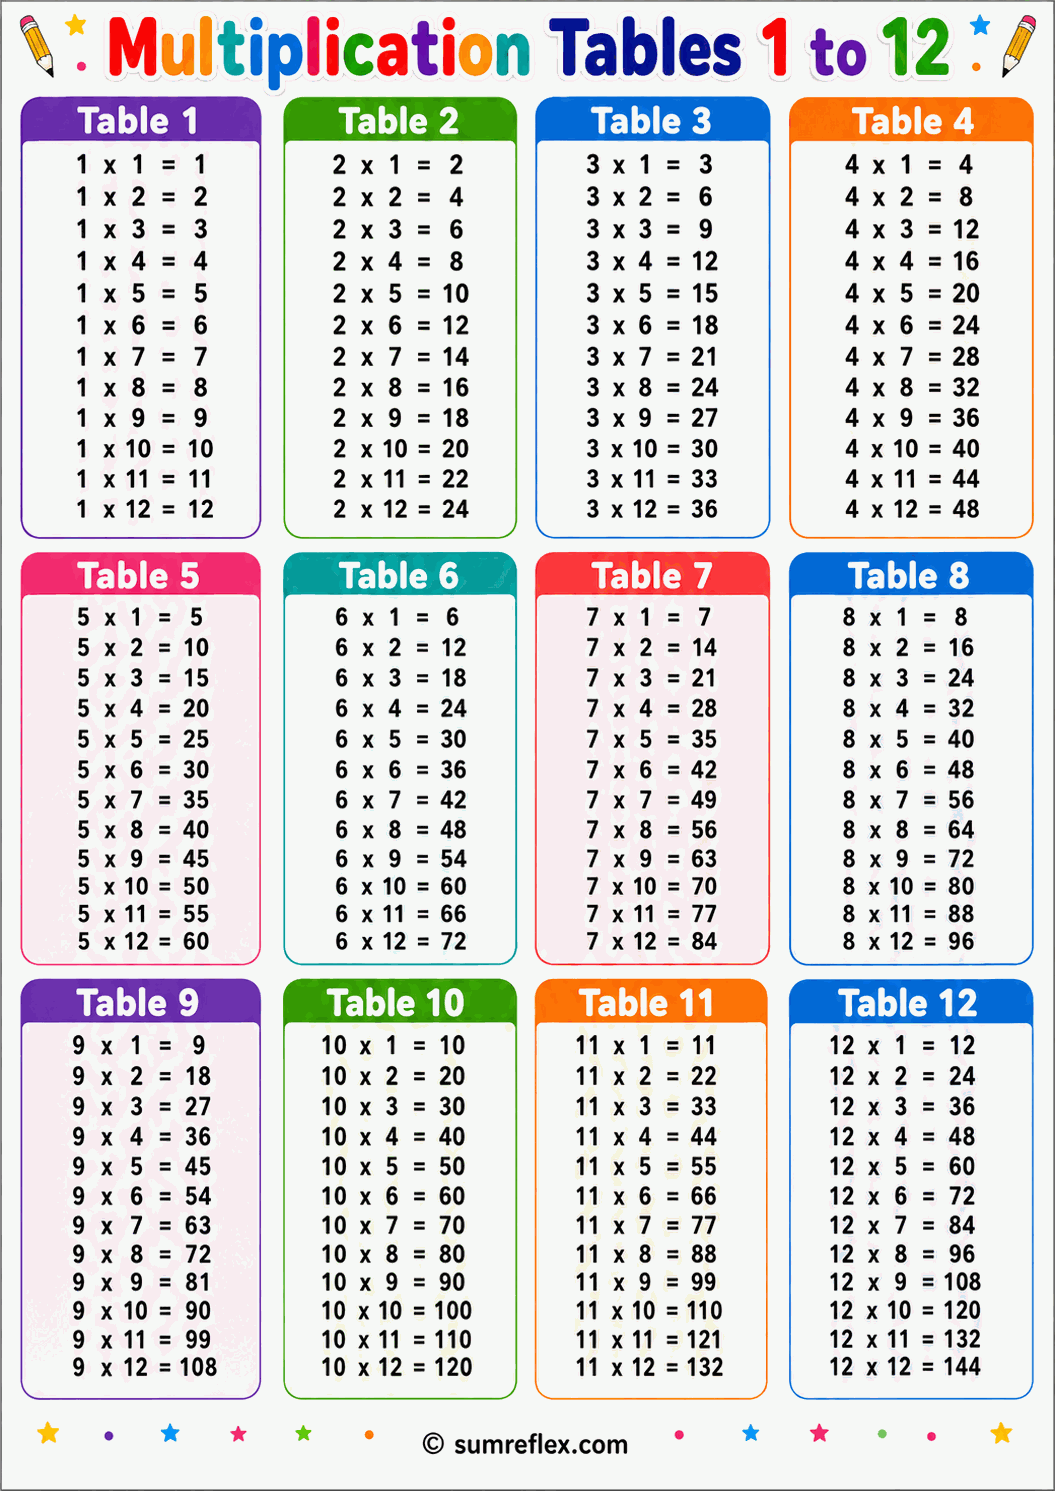
Classic multiplication grid guide
Using the 1 to 12 chart for core facts, dozens, and division links
The 1 to 12 range has a specific purpose
A 1 to 12 chart is not just a slightly larger version of a 1 to 10 chart. It includes the two rows that appear often in traditional multiplication work, measurement examples, dozens, clocks, and classroom fact review. Students can see the familiar facts through 10 while also keeping 11 and 12 close enough for comparison.
This range is especially helpful when a class is expected to know facts through 12 x 12. It gives a complete reference without adding the heavier products from 13 through 20.
Eleven and twelve need different attention
The 11 row has an early repeated-digit pattern, but that pattern does not explain every product. The 12 row connects to dozens and to 10 plus 2 thinking. Seeing both rows in the same grid helps students compare how different strategies work after the 10 row.
For focused row support, use the 11 times table chart or the 12 times table chart. This full grid is better when learners need to see how those rows sit beside all the earlier facts.
Division facts can be read from the same grid
The chart also supports division. If a student needs 96 divided by 12, they can scan the 12 row until they find 96, then read the matching factor 8. This keeps multiplication and division connected instead of treating division as a separate procedure.
Use this carefully. The goal is not to avoid division thinking forever. The goal is to help students see that a division question is often asking for a missing factor inside a multiplication relationship.
Square facts form a useful diagonal
The diagonal from 1 x 1 to 12 x 12 gives square facts, ending with 144. Highlighting that diagonal helps students locate anchors such as 6 x 6 = 36, 9 x 9 = 81, and 12 x 12 = 144. Nearby facts can then be built from those anchors.
For example, if 8 x 8 is 64, then 8 x 9 is one more group of 8, or 72. The chart becomes a map for reasoning instead of a flat answer sheet.
Dozens and inches make twelve practical
Twelve appears in ordinary contexts: 12 eggs in a dozen, 12 inches in a foot, 12 months in a year, and 12 main positions on many analog clocks. The chart can support those examples while still staying focused on multiplication.
Pair it with the units for measuring length chart when inches and feet appear, or with the months of the year chart when calendar examples are being discussed.
A classroom routine that does not overload students
Pick one row, one column, and one diagonal fact each day. Students read them, cover them, and answer a few selected facts from memory. This keeps the chart active without turning the whole grid into a memorization demand.
When a row is weak, move temporarily to a single-table chart. When the row becomes steadier, return to the full 1 to 12 grid for mixed practice.
Choosing between 1 to 10, 1 to 12, and 1 to 20
Use the 1 to 10 times table chart for compact core review. Use this 1 to 12 page when the traditional elementary range is the target. Use the 1 to 20 times table chart only when students are ready for extended products. The right chart is the one that matches the current practice goal.