



What the printable chart library is for
This section is built for reference pages that students can keep beside worksheets, homework, tutoring notes, or classroom stations. A chart is not meant to replace practice; it gives learners a stable place to check facts, notice patterns, and correct mistakes while they are still building fluency.
Why charts are grouped by skill
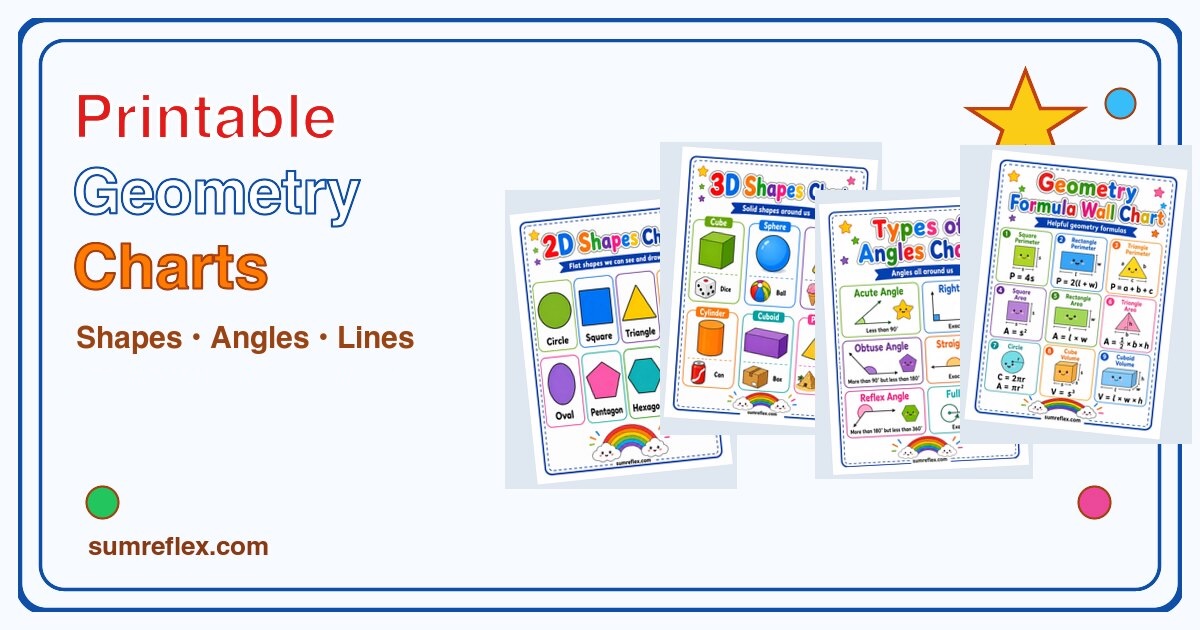
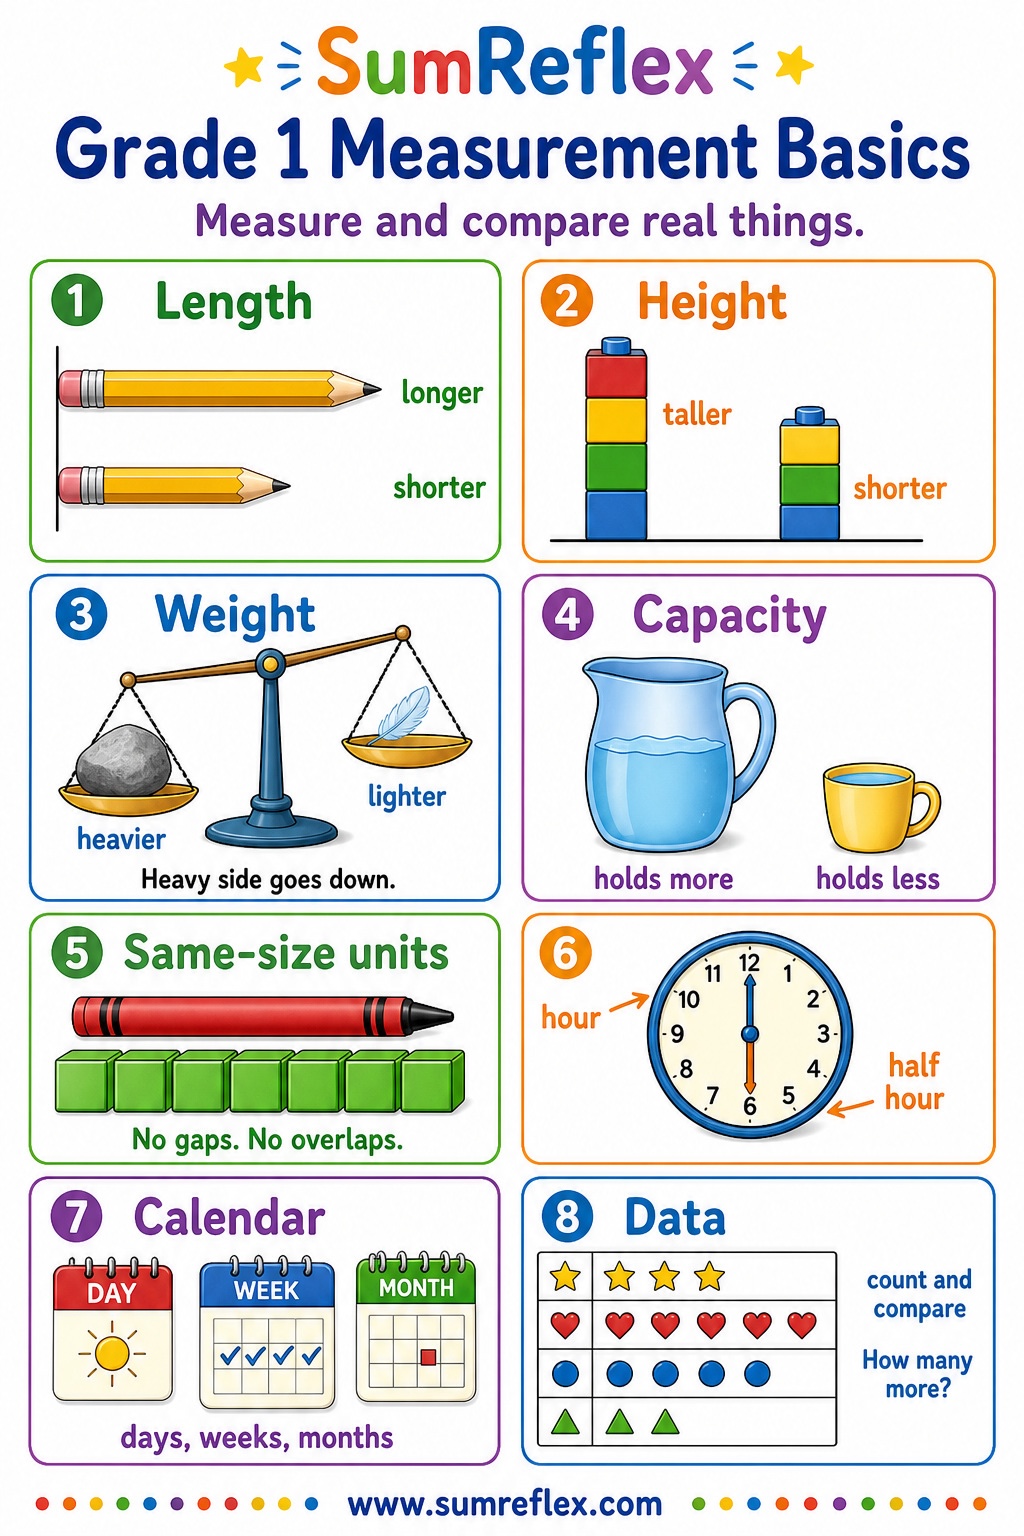
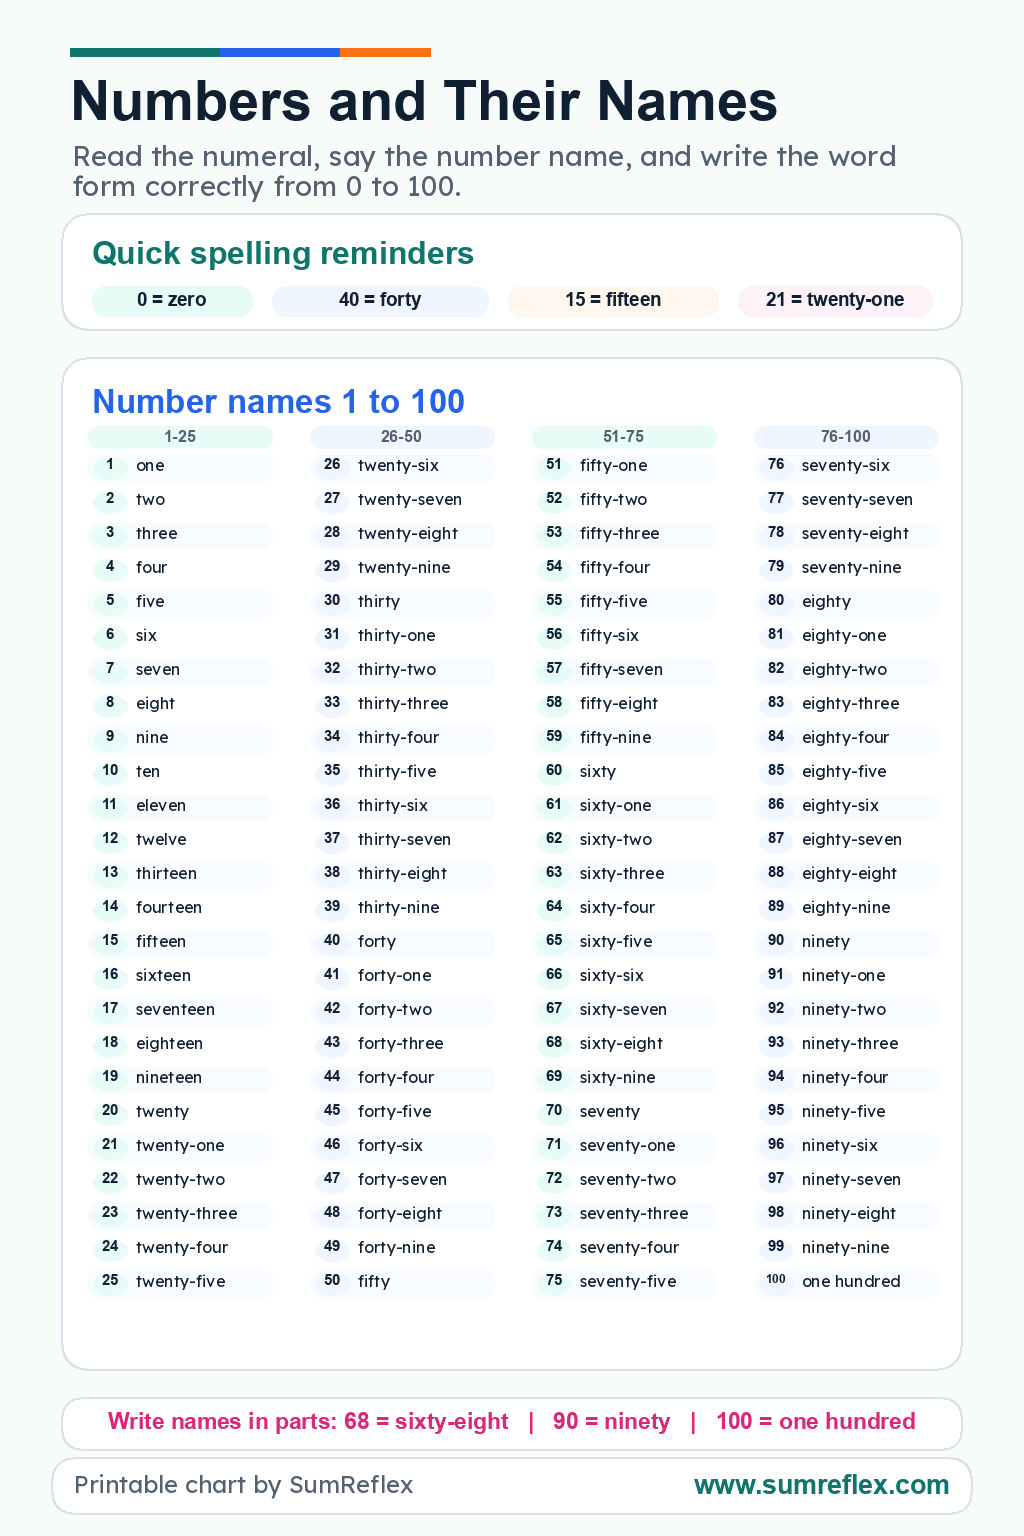
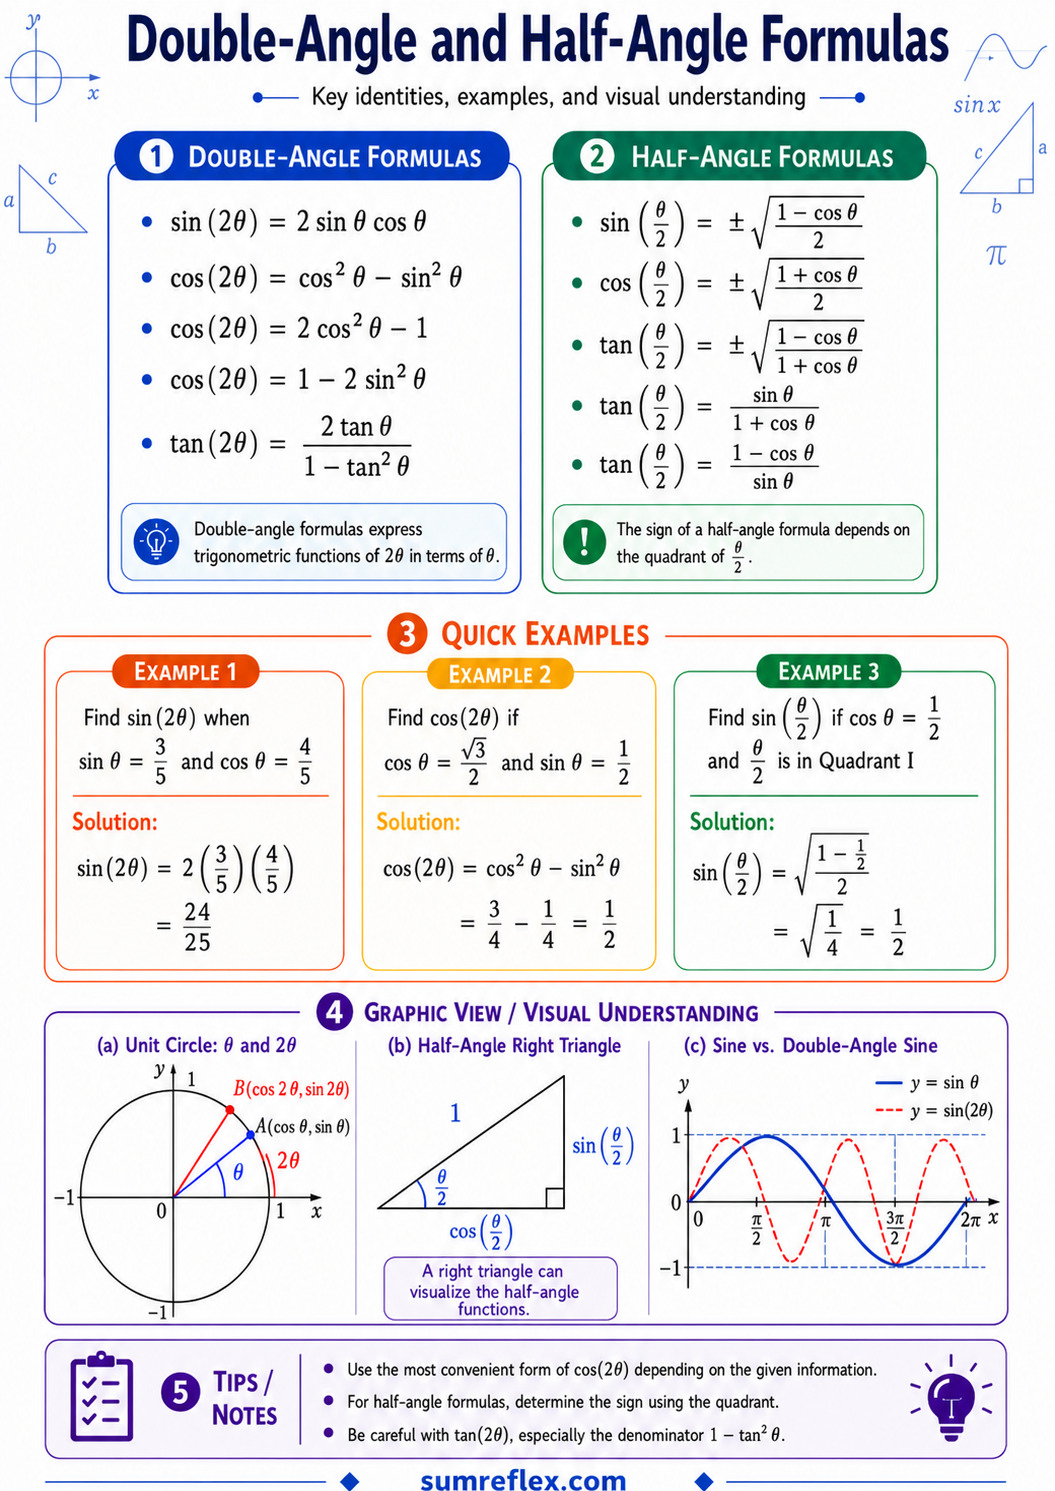
A multiplication table chart serves a different purpose from a math solving chart, number reference chart, measurement unit chart, geometry chart, or tracing chart. Keeping chart types in separate categories lets each page explain how to use that specific reference instead of repeating the same generic printable description.
Use charts before mixed drills
Many students benefit from looking at one organized reference before moving into a mixed worksheet or timed round. A chart gives them a way to see the structure of the facts first, then practice recalling the answers with less support.
Print the smallest useful chart
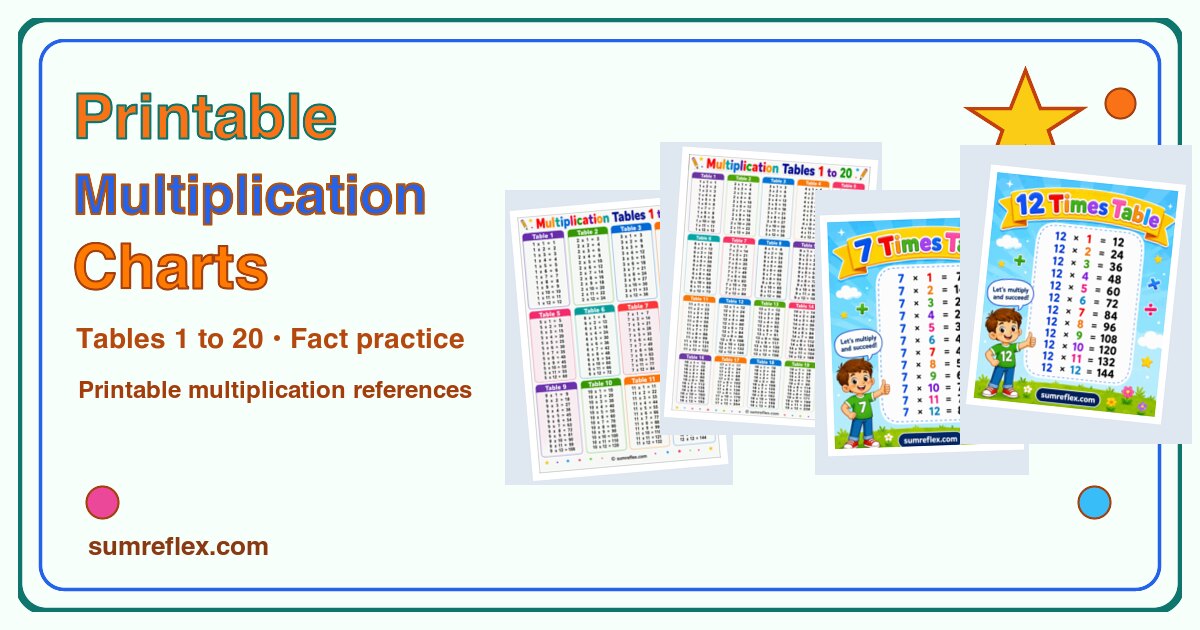
A focused chart is often better than a larger one. If a learner is working on the 6 table, print the 6 table chart instead of a full grid. If the goal is review across several facts, use a combined chart such as 1 to 10 or 1 to 12.
Turn reference into active practice
Ask students to cover one row, say the products aloud, and then uncover the chart to check. Another option is to circle patterns, highlight difficult facts, or write two related division facts beside a multiplication product.
Keep printed charts visible but purposeful
Charts work best when they are easy to find and used intentionally. Put one in a folder, on a desk, or near a practice area, but ask the learner to try the answer before checking the reference so the chart supports memory instead of replacing it.