



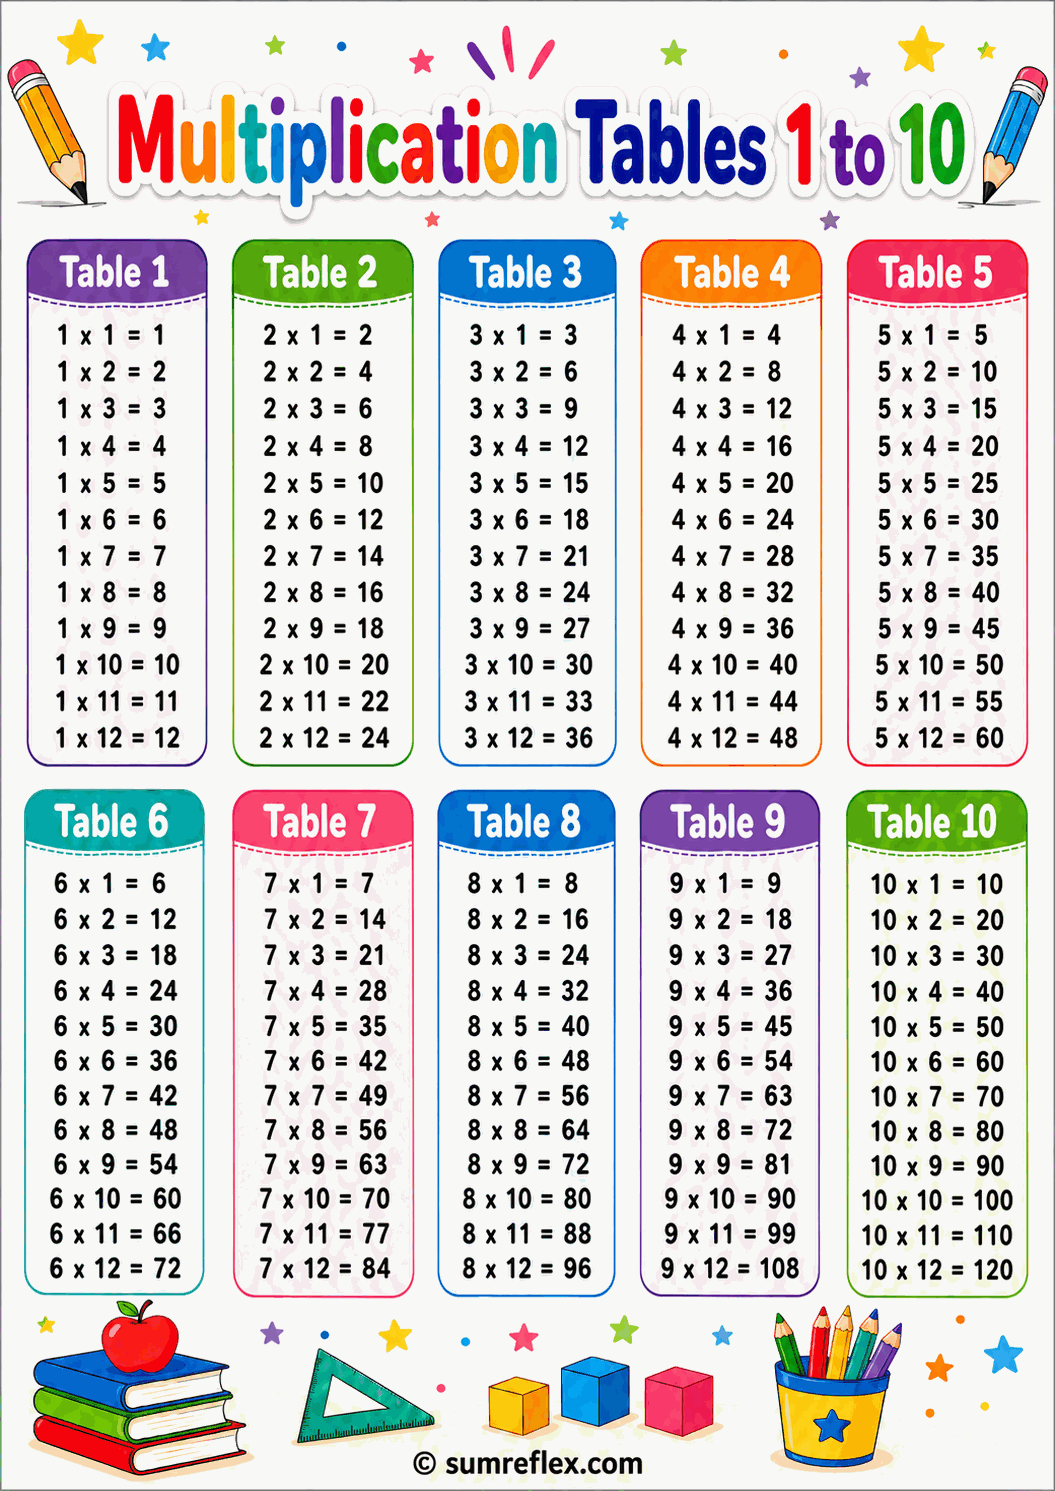
Core multiplication grid guide
Using the 1 to 10 chart as a pattern map, not just an answer table
The grid shows rows and columns at the same time
A single-row chart is useful when one table needs attention. A 1 to 10 grid has a different purpose. It lets students see how rows and columns meet. The product at a crossing point belongs to both factors, which helps learners understand why a multiplication chart is organized as a table.
Ask students to trace row 4 and column 4, then notice where they meet. Repeat with row 7 and column 8. This physical movement across the grid helps students read the chart instead of searching randomly for numbers.
Commutative pairs become visible
The grid makes factor-order relationships easy to see. The product for 3 x 8 matches the product for 8 x 3. The chart mirrors around the square-number diagonal, so students can learn that switching factors does not change the product.
This idea connects well to the commutative property of addition chart for younger operation work, but here the focus is multiplication. Students can color matching pairs on opposite sides of the diagonal to make the symmetry clear.
Square numbers form the spine of the chart
The diagonal from 1 x 1 through 10 x 10 contains square facts: 1, 4, 9, 16, 25, 36, 49, 64, 81, and 100. These products are useful anchors because they sit in the middle of related facts. If 7 x 7 is 49, then 7 x 8 is one more group of 7, or 56.
Have students highlight the diagonal and then use it to find nearby facts. The chart becomes a map of relationships instead of a flat list of answers.
Core rows still need individual attention
The full grid should not replace focused row practice. If a student struggles with one row, a single-table chart can provide cleaner support. For example, the 7 times table chart is better when sevens need targeted work, while this 1 to 10 grid is better for mixed checking and pattern spotting.
Use the grid after students have some row familiarity. Otherwise, the page can become a place to copy answers without building recall.
A gradual path from reference to memory
At first, students can keep the chart visible while solving multiplication problems. Later, cover one row, one column, or one corner. This gradual hiding encourages recall without removing support too suddenly. A blank strip over the 6 row can create a quick targeted review, while the rest of the grid stays available.
Another approach is to ask for the factor pair before the product. Point to 42 and ask which two factors inside the chart create it. This shifts the activity from answer lookup to relationship finding.
When a larger chart is useful
The 1 to 10 grid is the best compact reference for many elementary tasks. When students are ready for facts through 12, use the 1 to 12 times table chart. When they are extending into advanced rows, the 1 to 20 times table chart gives the broader range.
Keeping these charts separate matters. A smaller grid is easier for daily work, while larger grids support extension. Choose the chart that matches the facts being practiced, not the biggest chart available.
A daily two-minute routine
Choose one row, one column, and one diagonal square each day. Read them, cover them, and answer a few facts from memory. This short routine uses the chart as a study tool rather than a permanent crutch, and it keeps multiplication practice manageable.