



Eleven table strategy notes
Teaching the 11 table beyond the repeated-digit trick
The first nine facts invite pattern spotting
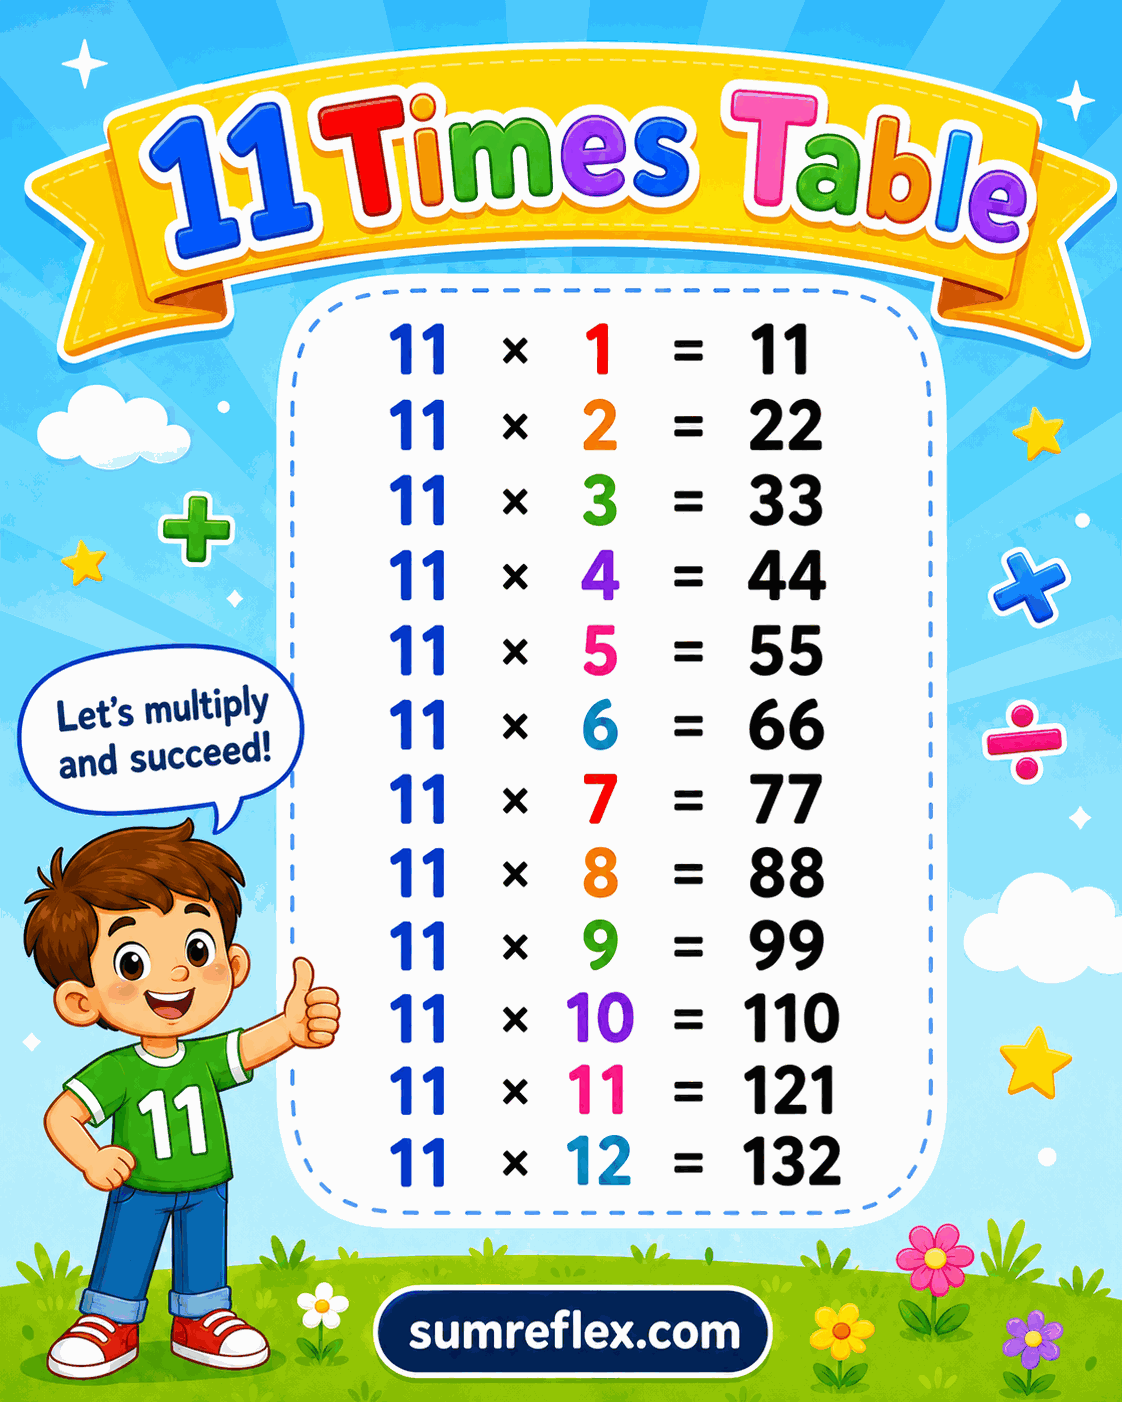
The early 11 facts are memorable: 11, 22, 33, 44, 55, 66, 77, 88, and 99. Students usually notice the repeated digits quickly. That pattern is useful because it makes the row feel friendly, but it should not be the only explanation. Eleven times 6 is 66 because 10 groups of 6 make 60 and one more group of 6 makes 66.
Ask students to say both explanations. First they can name the repeated-digit pattern. Then they can prove it with 10 plus 1 thinking. When both ideas are present, the row becomes a multiplication pattern rather than a visual trick.
The pattern changes after 9 x 11
Many errors in the 11 table happen when students try to stretch the repeated-digit idea too far. Eleven times 12 is 132, not 1212. Eleven times 15 is 165, not 1515. This chart is helpful because it shows the transition from tidy repeated digits to products that require real place-value calculation.
Use the chart to pause at 10 x 11, 11 x 11, and 12 x 11. Those facts show the shift clearly: 110, 121, and 132 each make sense when students build them from a ten-times product plus one more group.
Ten plus one is the safest method
The dependable strategy for every 11 fact is to split 11 into 10 and 1. For 11 x 8, students find 80 and 8, then combine them for 88. For 11 x 14, they find 140 and 14, then combine them for 154. The same method works before and after the repeated-digit pattern disappears.
This makes the 10 times table chart a natural nearby reference. Students who can multiply by 10 accurately can use that row as the base for each 11 fact.
Use the row to correct overextended shortcuts
When a student writes 11 x 13 as 1313, do not only mark it wrong. Ask them to build the fact: 10 x 13 is 130, and 1 x 13 is 13. The sum is 143. The chart can then confirm the product. This correction teaches why the answer changes instead of merely forbidding the shortcut.
A good worksheet prompt is to include one small fact, one fact around 11 x 11, and one larger fact. Students explain which facts can be recognized by the repeated-digit pattern and which ones need the full 10 plus 1 strategy.
Moving into the classic 1 to 12 range
The 11 table is part of the common 1 to 12 multiplication range, so it fits well beside the 1 to 12 times table chart. The full chart is useful for mixed practice. This single-page version is better when students need to slow down and study the behavior of one row.
For review, ask students to sort facts into two groups: products that can be recognized immediately from the repeated-digit pattern and products that should be built from 10 plus 1. That sorting task is quick, but it exposes whether students understand the limit of the pattern.
The chart can also be used for reverse questions. Show 154 and ask which 11 fact produced it. Students can reason that 140 plus 14 equals 154, so the hidden factor is 14. Reverse practice prepares them for division and factor work without changing the page into a different lesson.
A small writing task for stronger recall
Have learners write one sentence for a selected fact: "11 x 13 is 143 because 10 x 13 is 130 and one more 13 makes 143." The sentence is longer than the answer, but it proves that the student can explain the product. Use two or three written explanations, then let the chart handle quick checking for the rest of the row.