



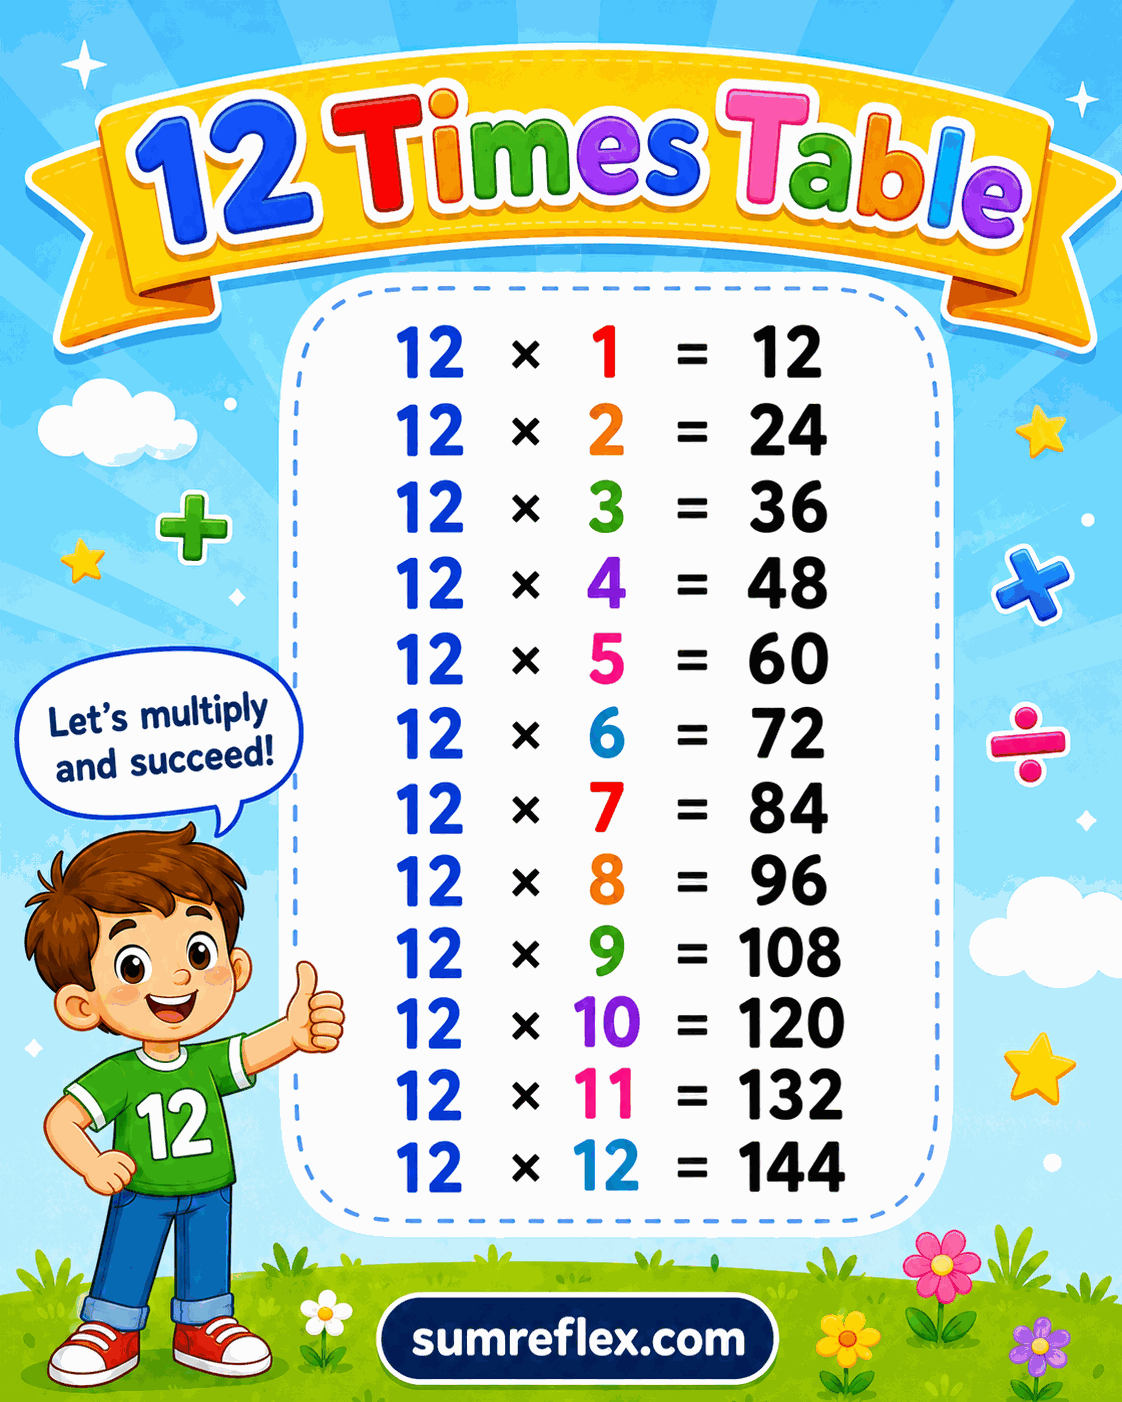
Twelve table practice guide
Learning the 12 table through dozens and measurement
Twelve is the bridge past ten
Many students first feel finished when they know tables through 10, but the 12 row is still part of the classic multiplication range. It gives practice with products such as 84, 96, 108, 120, 132, and 144. Those products are large enough to require attention but familiar enough to connect to real contexts.
A single 12 table chart keeps the row visible without making students search through a full grid. That matters when learners are working on one stubborn row and need fewer distractions.
Dozens make the row useful
The word dozen gives the 12 table an everyday meaning. Three dozen eggs are 36 eggs. Six dozen pencils are 72 pencils. Ten dozen items are 120 items. When students see the chart as a dozen-counting tool, the row stops feeling like an arbitrary extension after the 10 table.
Ask students to write a short label beside a few products: 4 dozen = 48, 7 dozen = 84, 12 dozen = 144. The label helps them connect the multiplication fact with a quantity they might actually count.
The 10 plus 2 split keeps work organized
A reliable strategy is to split 12 into 10 and 2. For 12 x 8, students can find 80 and 16, then add them to get 96. For 12 x 11, they can find 110 and 22, then combine them for 132. The chart is useful after the strategy because it confirms both the product and the place-value setup.
This split also connects naturally to the 2 times table chart and the 10 times table chart. Those smaller rows provide the parts that make the 12 row manageable.
Feet, months, and clock faces add context
Twelve appears in common measurement and time references. There are 12 inches in a foot, 12 months in a year, and 12 main number positions on many analog clock faces. These examples give students a reason to care about the row beyond memorization.
For calendar support, the months of the year chart can sit near this page. For time notation, the 24-hour clock chart adds a different kind of time reference. The 12 table itself stays focused on multiplication products.
A good row for checking products over 100
The 12 table takes students past 100 before the row ends. That is useful because it forces careful place value. If a student solves 12 x 9 as 98, the answer should feel suspicious because 10 x 9 is already 90 and two more groups of 9 should make the total 108. Estimation gives a first warning before the chart gives the exact correction.
Have learners predict whether each product should be below 100 or above 100 before checking the row. That small habit builds number sense while they practice fact recall.
Where to use the single-table page
Once the row is familiar, students can move to the 1 to 12 times table chart for mixed-grid practice. Keep this single 12 table printable for targeted review, dozen examples, and students who need space to explain the split strategy beside each product.
It also works well as a bridge between multiplication and measurement. A student can solve 12 x 5 as a fact, then read the same product as 5 feet equals 60 inches. Switching the label while keeping the product helps students see why the row appears so often outside pure arithmetic.