



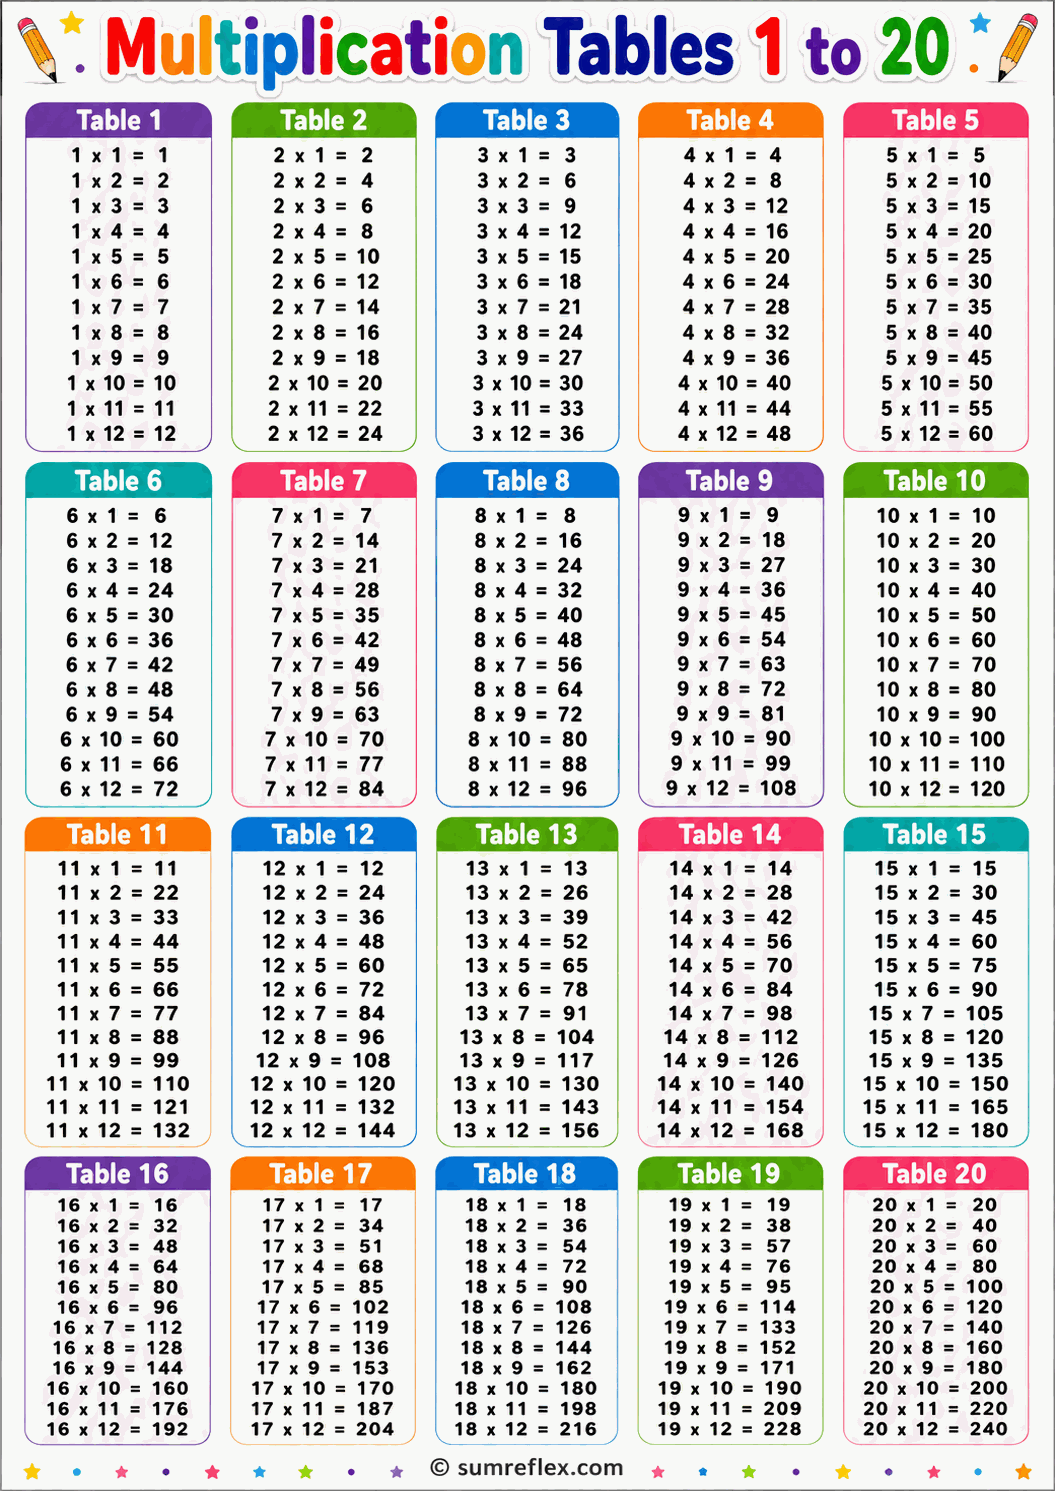
Extended multiplication grid guide
Reading the 1 to 20 chart as an advanced multiplication map
The larger grid should have a clear job
A 1 to 20 chart contains many products, so it should not be handed to a beginner as a first multiplication page. It is best for students who already understand core facts and are ready to explore extended rows such as 13, 14, 16, 18, 19, and 20. The chart is a reference and pattern map, not a demand to memorize every cell at once.
When used with a clear purpose, the larger grid helps students see how familiar facts continue into less familiar products. Rows beyond 12 become easier when they are connected to smaller rows and friendly-number strategies.
Extended rows have different strategies
The rows from 13 through 20 are not all learned the same way. The 14 row can be built by doubling the 7 row. The 16 row connects to repeated doubling. The 18 row can use 20 minus 2 or doubled nines. The 19 row is close to 20 minus 1. The 20 row is double ten.
A full grid lets students compare those strategies in one place. For targeted practice, the single-row charts for 14, 16, and 19 can slow the work down.
Color coding can make the chart readable
Because the page is dense, use color with a purpose. One color can mark facts the student already knows. Another can mark facts built by doubling. A third can mark facts that need more practice. This turns the chart into a progress map rather than a wall of numbers.
Students can also highlight the square-number diagonal from 1 x 1 through 20 x 20. That diagonal includes anchor products such as 100, 144, 225, 256, 324, and 400. Nearby products can be reasoned from those anchors.
The chart supports factors and multiples
A 1 to 20 grid is useful for more than multiplication recall. It helps students see multiples, common products, factor pairs, and number patterns. If a product appears in several places, students can discuss which factor pairs create it. The number 120, for example, can appear from more than one factor combination inside the larger grid.
This connects naturally to factor work. After students use the chart to locate products, the Factor Calculator can confirm a full factor list when the question moves beyond the visible grid.
Keep extended practice targeted
Do not ask students to practice all 400 facts at once. Pick a purpose: compare 18 and 20, find products above 200, locate square facts, or identify multiples of 15. A large grid is powerful because it can answer many questions, but each session should still have one clear focus.
Short focused tasks prevent overload. They also help students see relationships that a smaller chart cannot show.
When a smaller chart is better
If the student is still building core facts, use the 1 to 10 times table chart or the 1 to 12 times table chart instead. Smaller charts reduce scanning and make early fact practice less crowded.
This 1 to 20 page is the right choice for extension, enrichment, older students, and mental math conversations that involve larger products.
A strong activity for older learners
Choose one product above 150 and ask students to find every visible factor pair that creates it inside the chart. Then ask which pair is easiest to calculate mentally and why. This activity turns the printable into a reasoning tool and encourages students to compare factor structures, not just read answers.