



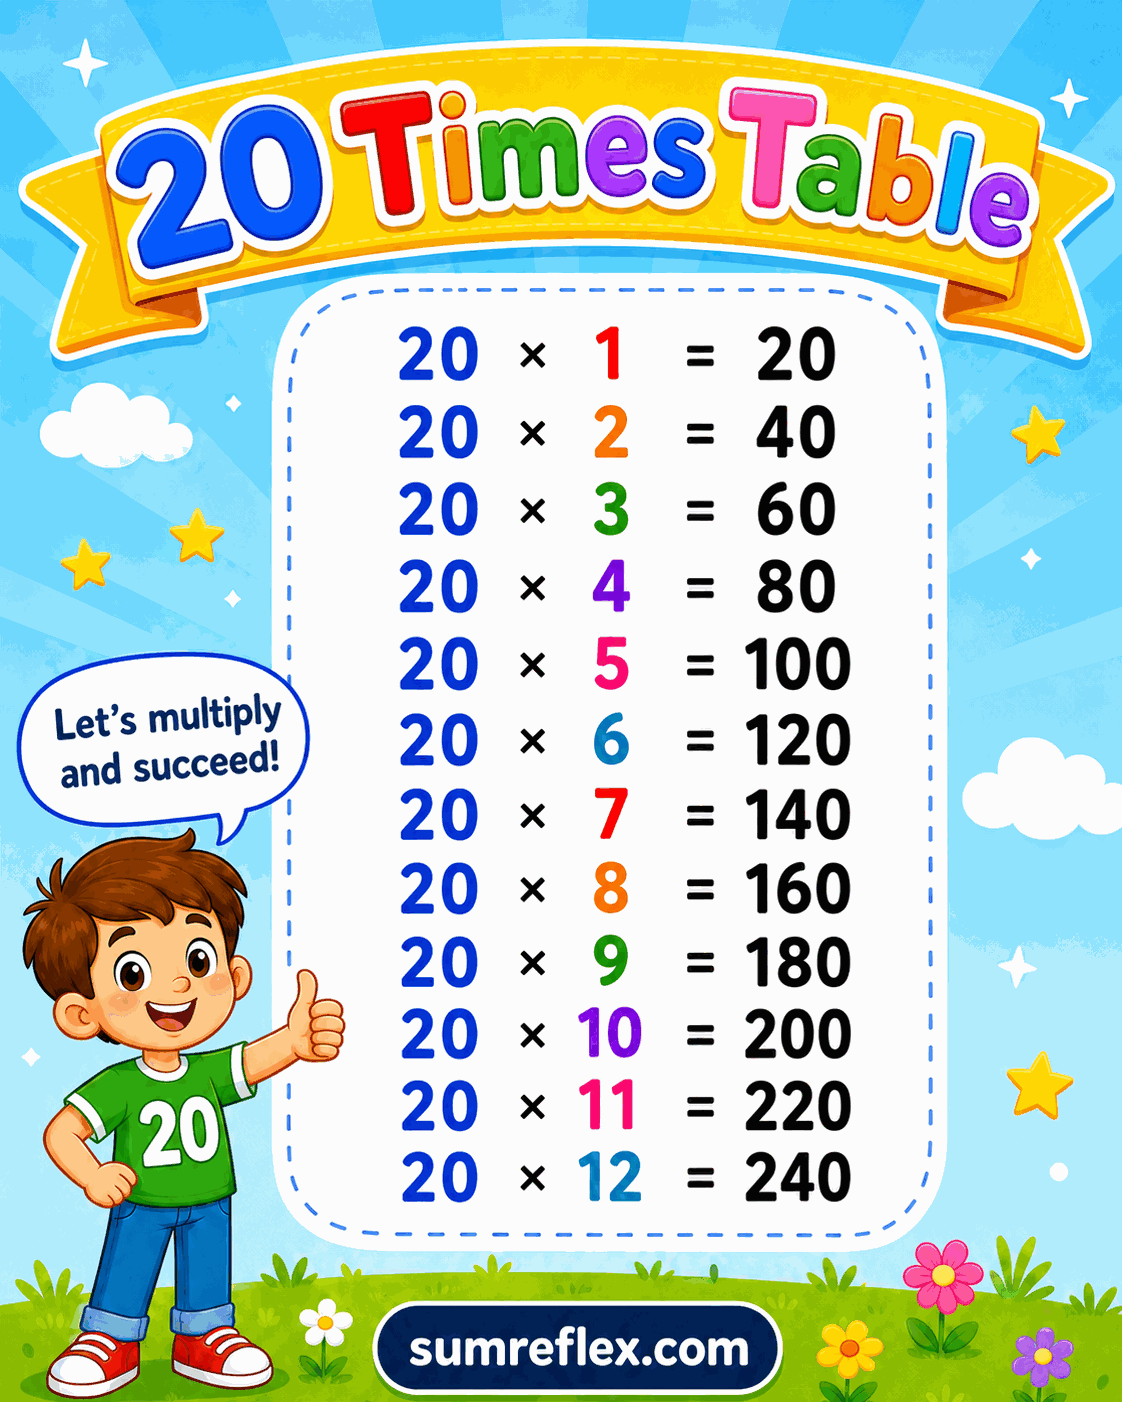
Twenty table extension guide
Building the 20 table from doubles and tens
Twenty is double ten
The 20 row is not a brand-new structure. It is twice the 10 row. If 10 x 8 is 80, then 20 x 8 is 160. If 10 x 12 is 120, then 20 x 12 is 240. The chart gives the final products, but the double-ten relationship gives students a way to create them.
This makes the 10 times table chart a useful support. Students can read a 10 table product, double it, and then confirm the matching 20 table product.
Double first, then attach place value
Another route is to double the factor and then multiply by 10. For 20 x 9, double 9 to get 18, then make 180. For 20 x 14, double 14 to get 28, then make 280. This method keeps the row connected to the 2 table and place value at the same time.
Students who are still building doubling fluency can pair this page with the 2 times table chart. The 20 row is larger, but the first mental step is still a double.
The products are useful benchmarks
The 20 table is a strong estimation row. A product involving 19 groups should be a little less than the matching 20 product. A product involving 18 groups should be lower by two groups. This is why the 20 chart is useful even when students are studying nearby rows.
The 19 times table chart and 18 times table chart both connect naturally to this page. Students can compare the rows and see how a small factor change affects the total.
Twenties appear in practical grouping
Groups of 20 show up in classroom stacks, scorekeeping, time blocks, packs of materials, and quick money estimates. If each packet has 20 sheets, 7 packets contain 140 sheets. If a game gives 20 points per round, 11 rounds produce 220 points. These examples give the row a practical reason to exist.
Ask students to invent one context for a product from the chart. A story for 20 x 6 might involve six boxes with 20 markers each. That story helps the product become a quantity rather than only a printed answer.
A clean check for large answers
Because the products grow quickly, students should estimate before checking the chart. Twenty times 15 should be greater than 200 and equal to three hundreds. If a learner writes 30 or 3000, place-value reasoning should catch the error immediately.
The place value chart can help students explain why products such as 260 and 340 have the digits they do. The 20 table is as much about tens as it is about multiplication.
When to move into the full grid
After this row is understood, the 1 to 20 times table chart is useful for mixed review. Keep the single 20 chart for strategy teaching, near-20 comparisons, and students who need uncluttered practice with the largest standard row.
A useful written routine is to ask students to solve a fact two ways: double the factor and attach a zero, then double the matching 10 table product. For 20 x 13, both paths should land on 260. When two methods agree, students can trust the product and see why the row is built from familiar parts.
The chart can also be used backward. If the product is 180, students can divide by 10 to get 18, then halve to find the original factor 9. This reverse reasoning prepares them for division and factor questions.