



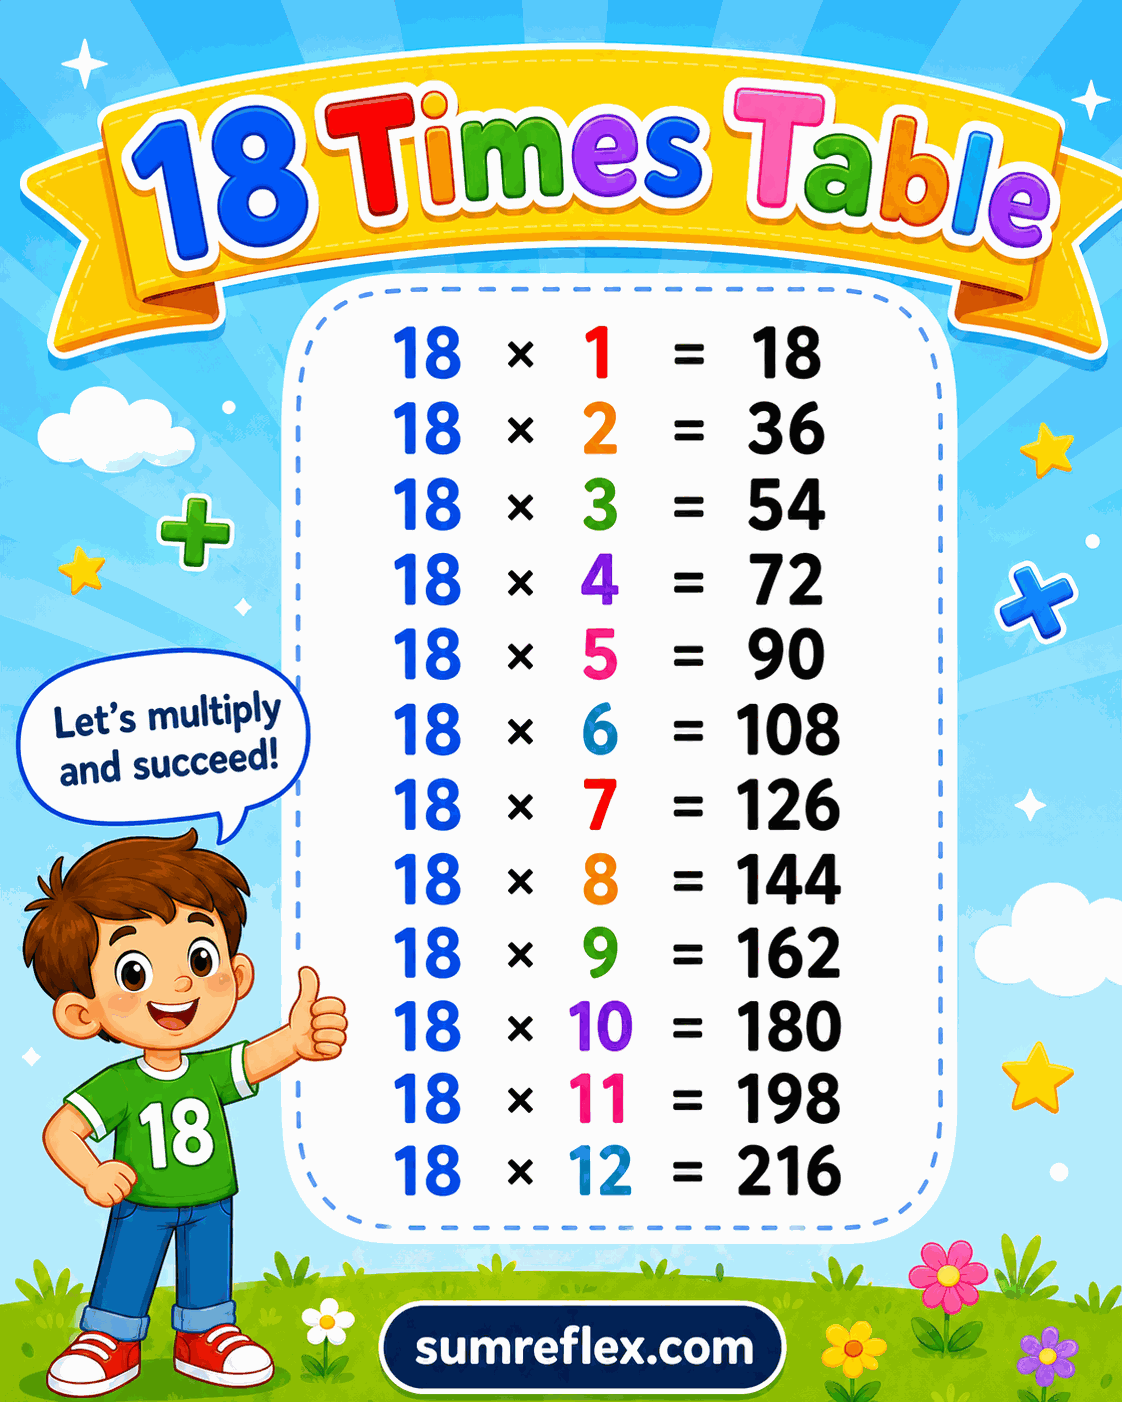
Eighteen table strategy guide
Using near-20 thinking and doubled nines for the 18 table
Twenty minus two gives a clear adjustment
The near-20 strategy is often the fastest way to reason through the 18 row. For 18 x 7, students can begin with 20 x 7 = 140, then subtract 2 x 7 = 14. The final product is 126. The chart is useful because it confirms the adjustment after the student has done the mental work.
This strategy also teaches product size. An 18 table product should sit just below the matching 20 table product, not far away from it. That expectation helps students catch careless answers before they rely on the chart.
Doubled nines offer a second route
Since 18 is double 9, students can also build the row from the 9 table. If 9 x 8 is 72, then 18 x 8 is 144. If 9 x 11 is 99, then 18 x 11 is 198. This method is especially useful for students who already know nines well.
The 9 times table chart can sit beside this page for comparison. Students can double a nines product and then check the matching 18 product.
Every product should be even
Because 18 is even, every product in the row is even. This gives a quick first check. If a learner writes 18 x 5 = 95, the answer cannot be right because an even number times a whole number gives an even product. The correct answer is 90.
That even check is not enough by itself, because many wrong answers are still even. Pair it with the near-20 estimate. For 18 x 12, the product should be a little below 240, and 216 makes sense in that range.
Avoid subtracting only one group
A common mistake with the near-20 method is subtracting one group instead of two. If a student solves 18 x 6 by doing 120 minus 6, they get 114, which is actually 19 x 6. Since 18 is two less than 20, the adjustment must remove two groups of 6.
Ask students to say the adjustment out loud: "twenty groups minus two groups." That wording makes the difference clear and helps prevent the one-group error.
Use the chart as a comparison page
This printable works well when students write three columns: 20 table product, amount removed, 18 table product. For 18 x 9, they write 180, remove 18, and get 162. Then they confirm the value on the chart. The process is organized and easy to audit.
For broader mixed practice, the 1 to 20 times table chart can follow. This single-table page is better when the lesson is about the adjustment strategy itself.
A short estimation prompt
Before checking any 18 fact, ask students to name the nearest 20 table product and then say how much lower the answer should be. That one sentence turns chart practice into mental math: 18 x 7 is near 140, but 14 lower.
For written work, have students compare two methods on the same fact. They might solve 18 x 8 as 160 minus 16, then solve it again as double 72 from the 9 table. When both routes produce 144, students gain confidence that the product is not a guess.
The row can also be extended by repeated addition. Starting at 180 for 18 x 10, the next facts are 198 and 216. Counting forward from an anchor helps students avoid starting at 18 every time.
Anchors make the row easier to navigate during mixed review and oral questioning.
They also reduce fatigue.