



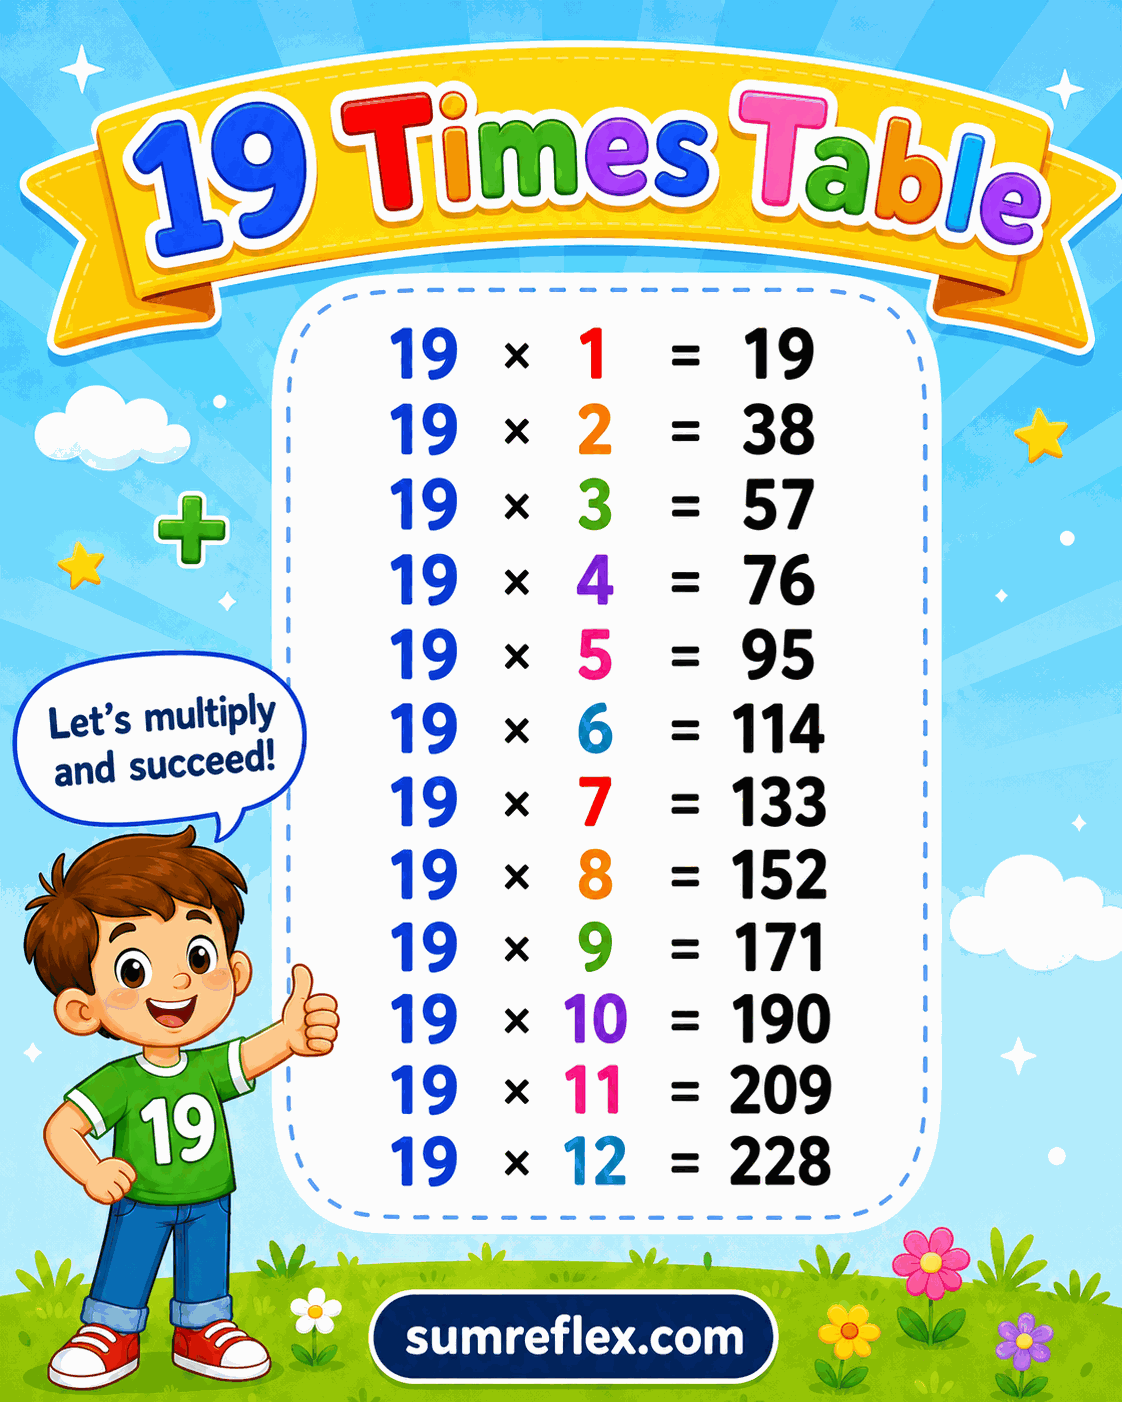
Nineteen table mental math guide
Making the 19 table manageable with 20 minus 1
The row lives just below the 20 table
The simplest way to think about the 19 table is to start from 20. For 19 x 8, students calculate 20 x 8 = 160, then subtract one group of 8. The answer is 152. For 19 x 12, they calculate 240 minus 12, which gives 228.
The chart lets students check these adjusted products without losing sight of the full row. It is especially useful because 19 facts look difficult until the near-20 relationship is made explicit.
One group is removed, not two
This page pairs naturally with the 18 table, but the adjustment is different. Eighteen removes two groups from the 20 table. Nineteen removes only one group. That smaller adjustment is why 19 x 9 is 171, while 18 x 9 is 162.
Use contrast questions to make this clear. Ask students to solve 20 x 7, then 19 x 7, then 18 x 7. The answers 140, 133, and 126 show the products stepping down by groups of 7.
The 20 table can be a temporary helper
Students do not need to memorize the 19 row immediately if they can use a reliable helper. The 20 times table chart gives the nearby products. From there, students subtract the factor once and compare with this 19 chart.
This approach is good mental math practice because it asks learners to hold a friendly product, make a small subtraction, and check whether the result is reasonable.
Estimate first, then calculate
Every 19 product should be just below a matching 20 product. That makes estimation easy. Nineteen times 6 should be just below 120. Nineteen times 14 should be just below 280. If a student gets an answer far away from that benchmark, the calculation needs review.
Estimation is especially helpful when products pass 200. A chart check is useful, but a size check helps students catch errors before they copy or accept an answer.
Where prime status matters
Nineteen is prime, so the row is not a doubled version of a smaller multiplication table. Students who are studying factors can connect that idea with the prime and composite numbers chart. The best practical strategy is not to search for a smaller hidden row, but to use the nearby 20 row.
This also makes the 19 chart useful for enrichment. It shows how a difficult table can become manageable when students choose a nearby friendly number.
A concise practice routine
For each fact, have students write the 20 table product, the group to subtract, and the final answer. For 19 x 11, they write 220, subtract 11, and get 209. After several rounds, they can do the same thinking mentally and use the chart only for confirmation.
When learners are ready for mixed products, the 1 to 20 times table chart can provide the larger grid. This page remains the better reference for explaining the 20 minus 1 strategy clearly.
For reverse practice, show a product such as 171 and ask which factor created it. Students can compare it with the 20 table: 180 is 20 x 9, and 171 is 9 less, so the fact is 19 x 9. This reverse thinking strengthens factor recognition and prepares students for division questions.
A row for confident advanced learners
The 19 table is not usually an early memorization target, but it rewards students who can adjust from friendly numbers. Use it as a mental-math challenge after the smaller rows are stable. The chart keeps the challenge accurate while the strategy develops.