



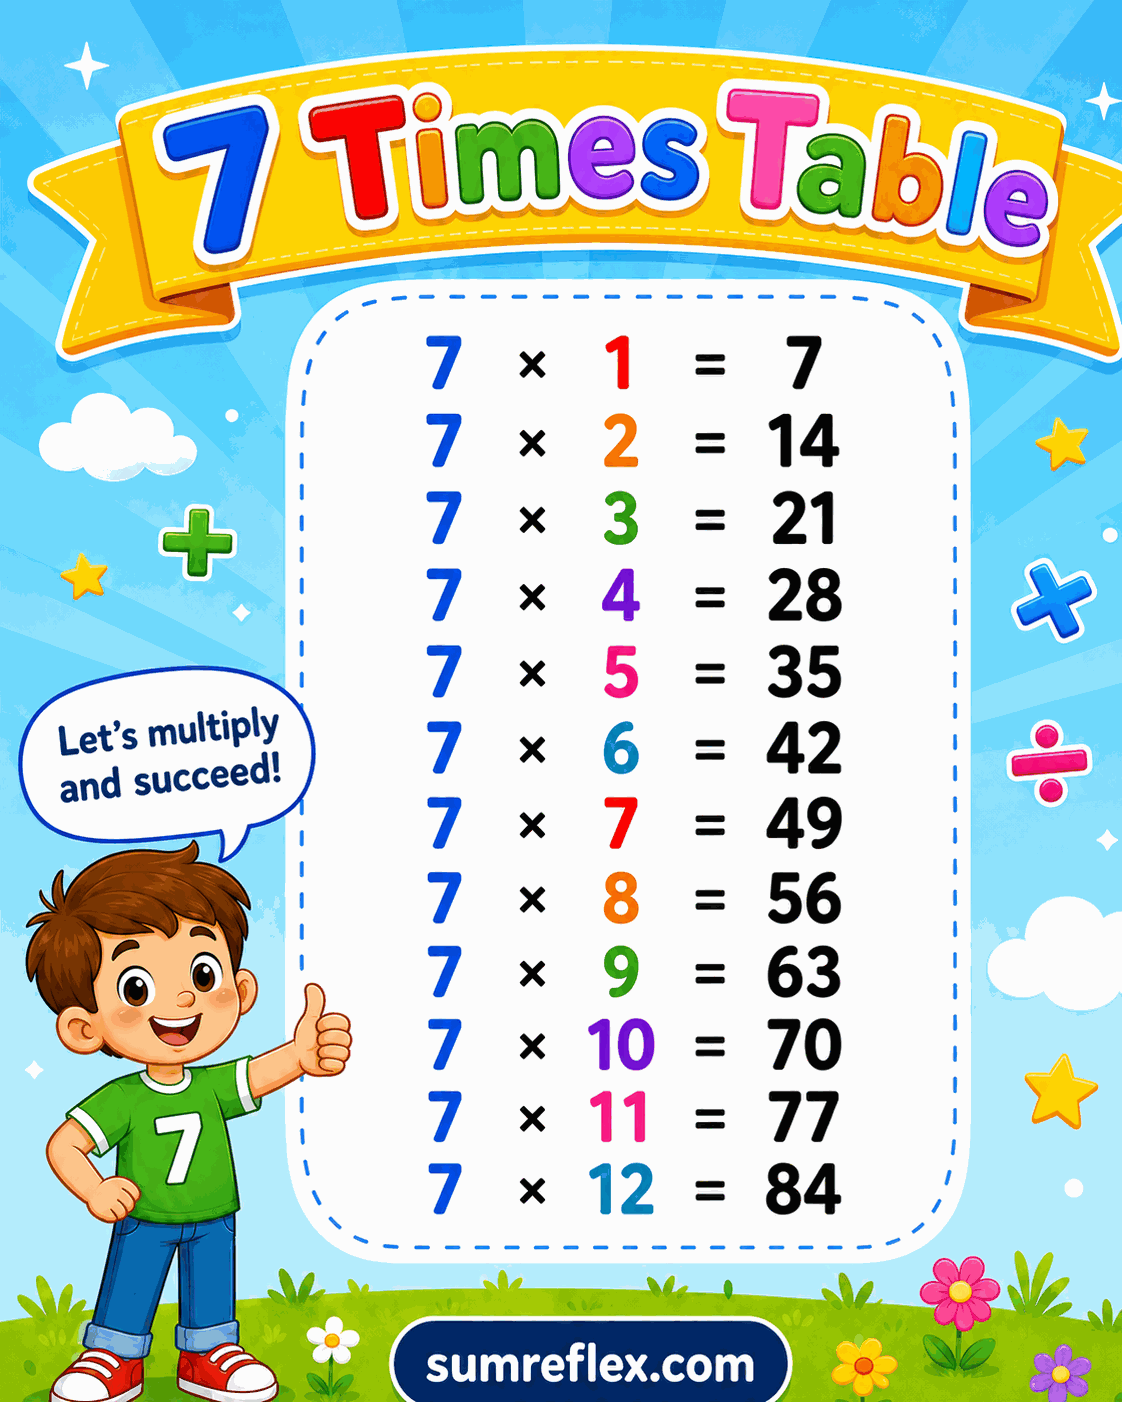
Seven table practice guide
Learning the 7 table with landmarks instead of pressure
Weeks give seven a familiar meaning
Seven has a natural calendar connection: one week is 7 days, two weeks are 14 days, and three weeks are 21 days. This context gives students a practical way to understand the row. The chart then extends those weekly totals through the multiplication facts.
For students still learning weekday order, the days of the week chart can support the calendar side. The 7 times table page focuses on total days across repeated weeks.
Landmark facts reduce the load
Instead of trying to memorize every 7 fact at once, students can build around landmarks. Seven times 5 is 35, seven times 7 is 49, and seven times 10 is 70. From those anchors, nearby facts become easier. Seven times 6 is one group past 35, and seven times 9 is one group before 70.
Marking the landmarks on the chart gives students stopping points inside the row. The goal is not only to recite the sequence, but to know where they are in it.
Nearby facts are better than guessing
When a fact is hard, ask what fact is close. If 7 x 8 is unknown, students can use 7 x 7 = 49 and add 7 to get 56. If 7 x 6 is unknown, they can use 7 x 5 = 35 and add 7 to get 42. This is more reliable than guessing from memory.
The chart supports this method because nearby products are visible in order. Students can see that the row rises by 7 each time.
Short review works better than long drills
The 7 table can become stressful if practice turns into a speed test too early. Keep sessions short. Ask five facts, review only the missed ones, and have students explain one strategy aloud. A correct explanation is often more valuable than a fast answer with no reasoning.
This printable is useful for that kind of review because it isolates the row. Students do not have to scan a full grid while they are still stabilizing the 7 facts.
Skip counting is a support page
The skip count by 7 chart is helpful when students need to hear the sequence and practice equal jumps. This times-table chart should be used when the focus is fact notation: 7 x 8, 8 x 7, and the product 56.
Pairing both pages can help students move from counting to fact recall. The skip-count page shows the path; the times-table page names each multiplication stop.
A reverse check for stronger memory
Show a product from the row and ask for the fact. If students see 63, they should connect it to 7 x 9. If they see 42, they can connect it to 7 x 6. Reverse practice prepares students for division and factor questions without introducing a new tool.
For a second pass, ask students to place that product between two neighboring products. The number 56 sits between 49 and 63, so it belongs to the eighth group of seven. This neighbor reasoning helps students check products even when they cannot recall the answer immediately.
The chart can stay visible during explanation, then be covered for a short recall round. Alternating support and recall keeps practice calm while still moving toward memory.
A weekly context can return here too: 8 weeks is 56 days, which matches 7 x 8. The familiar calendar label gives the product a practical anchor.