



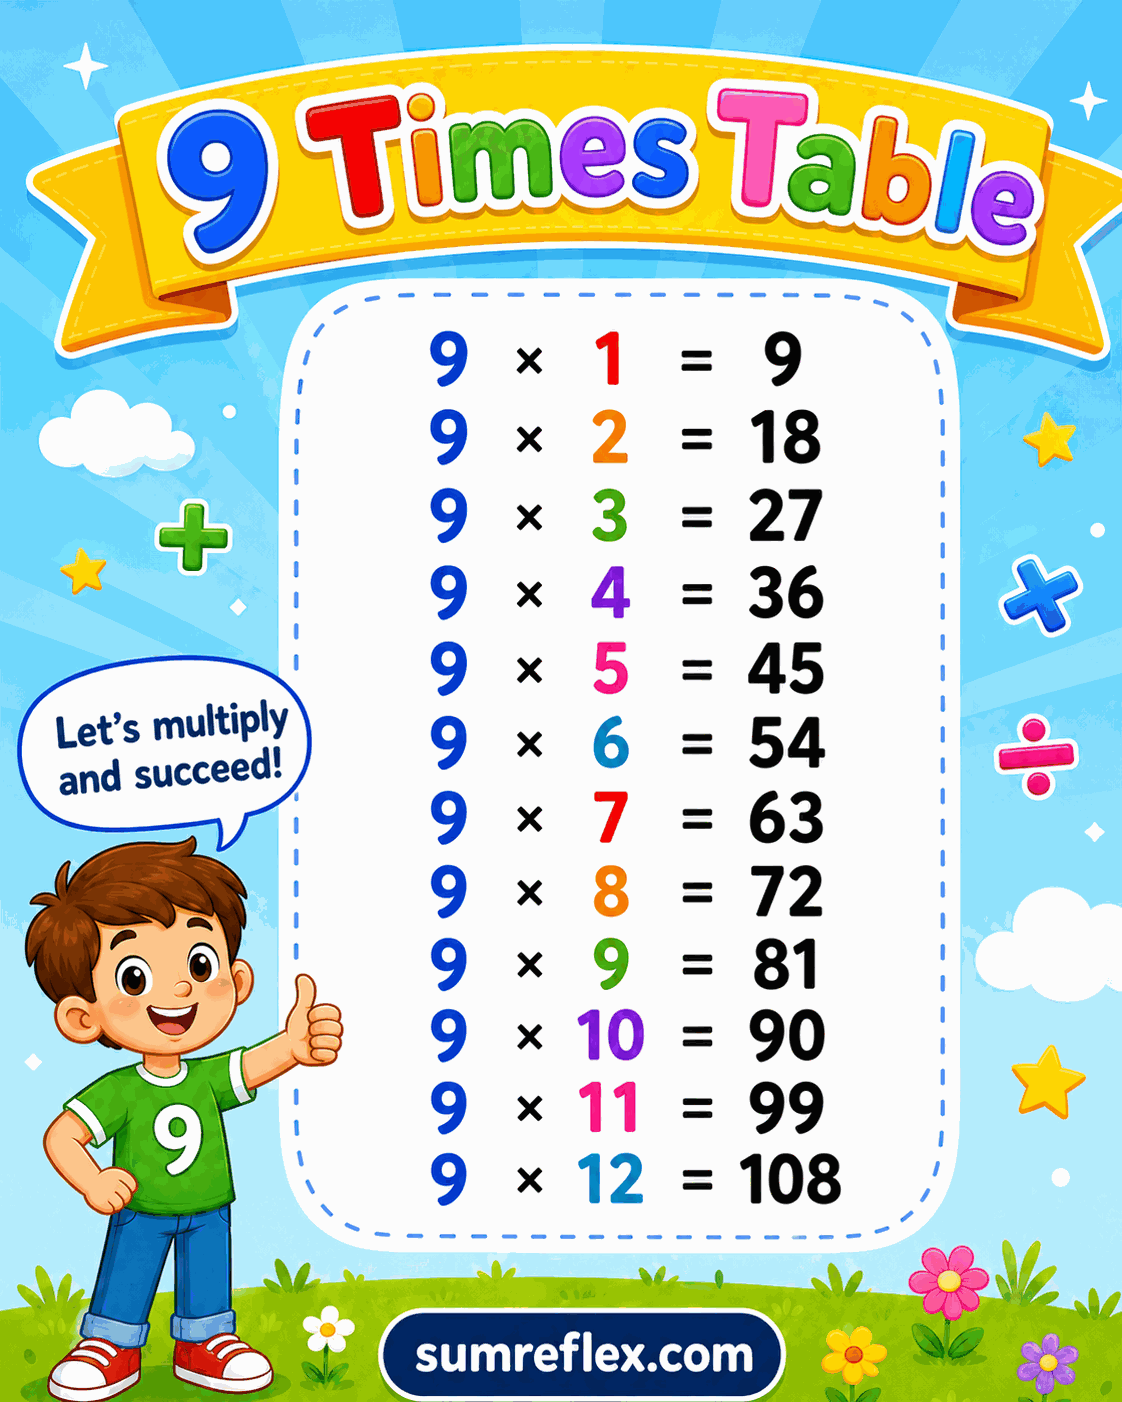
Nine table pattern guide
Using near-ten thinking and digit checks for the 9 table
Nine is one less than ten
A dependable way to build the 9 row is to start with the 10 table and subtract one group. For 9 x 8, students can think 10 x 8 = 80, then subtract 8 to get 72. For 9 x 12, they can think 120 minus 12, which gives 108.
This makes the 10 times table chart a helpful support. Students can begin with a friendly tens product and then adjust down by the factor.
The digits form a visible pattern
In the early 9 row, the tens digit rises while the ones digit falls: 09, 18, 27, 36, 45, 54, 63, 72, 81, and 90. Students often notice this pattern quickly. The chart lets them see it in order and use it as a check.
The pattern should still be connected to multiplication. Each product is nine more than the one before it, and each product represents a certain number of equal groups of nine.
Digit sums support error checking
Many products in the 9 row have digits that add to 9. For 63, 6 + 3 = 9. For 81, 8 + 1 = 9. This check is useful after students answer a fact, especially when they are working quickly.
The divisible by 9 chart explains the digit-sum rule in more detail. This times-table chart gives the products that make the rule feel familiar.
Do not let the pattern replace meaning
The 9 row has several memorable tricks, but students still need to understand the multiplication. Nine times 6 means 6 groups of 9, or 54. The fact can be found through 60 minus 6, but it still represents equal groups.
Ask students to explain one product with the near-ten strategy and another product with repeated addition or an array. This prevents the digit pattern from becoming a shortcut with no underlying meaning.
A good routine for mixed practice
Cover the products and ask for facts out of order: 9 x 4, 9 x 11, 9 x 7, 9 x 2. After each answer, students check with either the near-ten strategy or the digit-sum observation. The chart confirms the final product.
The skip count by 9 chart can support sequence practice if students still lose the row in order. This times-table page focuses on individual multiplication facts.
Where nines connect to larger rows
Knowing the 9 row helps with 18 because 18 is double 9. The 18 times table chart can use doubled nines as one of its strategies. That connection shows students that familiar rows can support advanced multiplication later.
For reverse practice, show a product such as 72 and ask which 9 fact created it. Students can compare it with 80 from the 10 table and notice that 72 is 8 less, so it belongs to 9 x 8. This reverse use strengthens both multiplication and division readiness.
A good final check is to ask students to explain one product without mentioning the digit trick. Nine times 7 can be 10 times 7 minus 7, or seven groups of nine. That explanation keeps the row connected to multiplication meaning.
When students can use both the pattern and the near-ten strategy, the chart becomes a confirmation tool rather than the only source of the answer.
For another check, have students compare 9 x 8 with 8 x 9. Both facts give 72, but the near-ten explanation works especially smoothly from 9 x 8 because it starts at 10 groups of 8. Seeing both forms helps students move between rows without thinking the answer has changed.
The 9 row also prepares students for mental subtraction. Every near-ten strategy asks them to remove one group from a tens product. That makes the table useful for multiplication fluency and subtraction flexibility at the same time.