



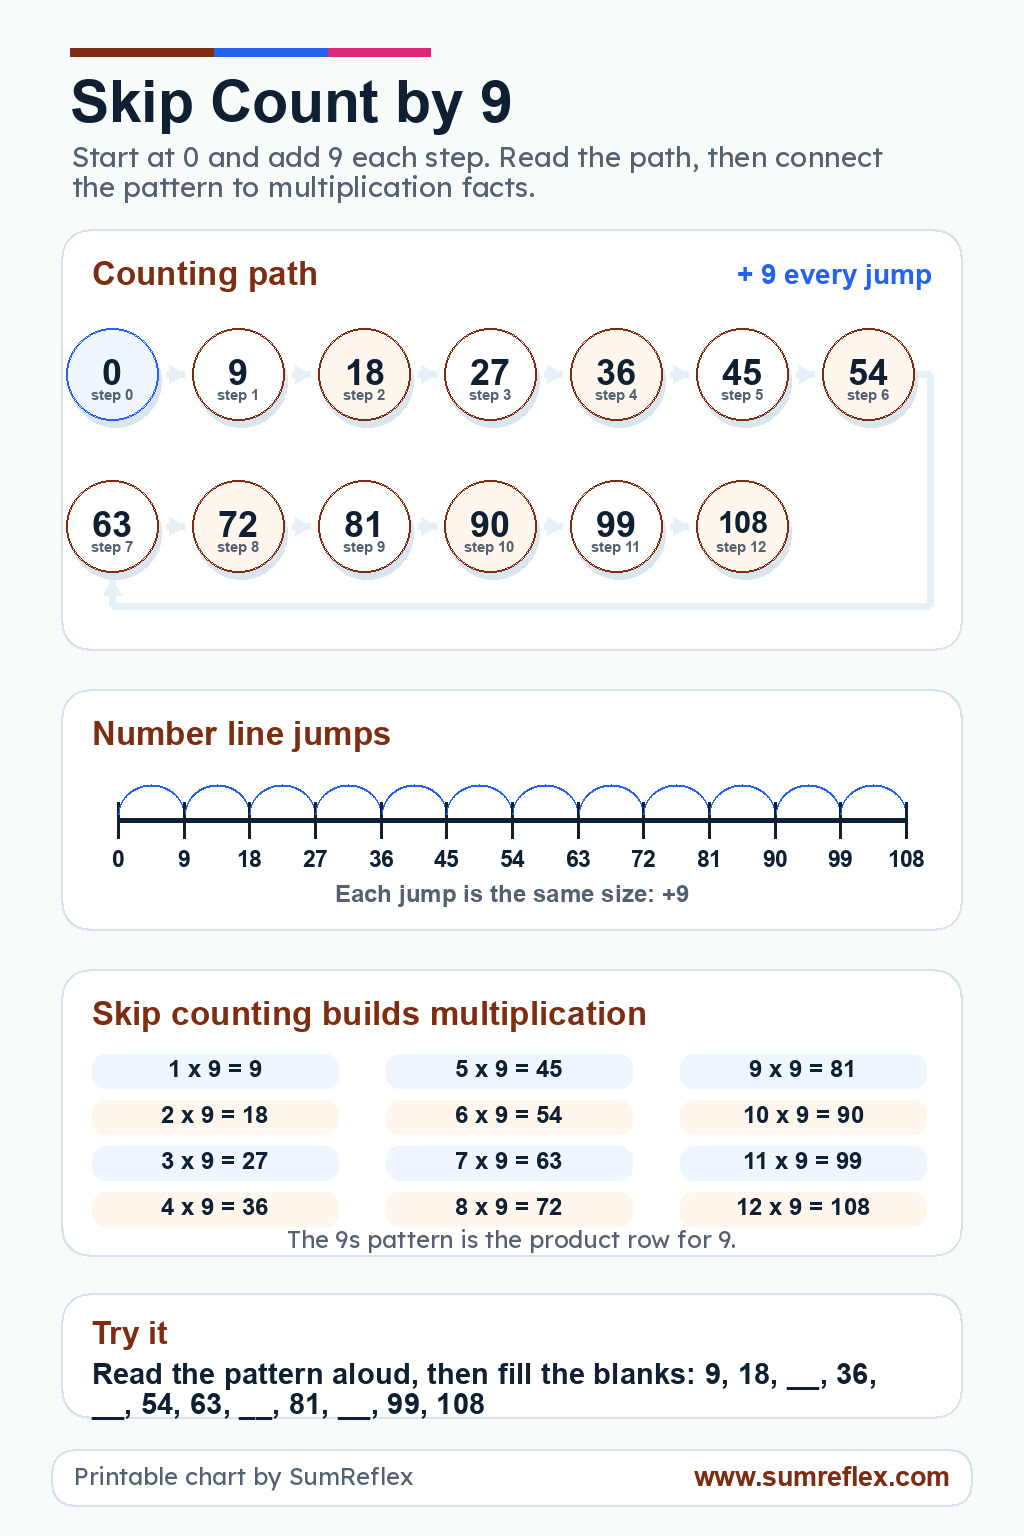
Nines counting guide
Understanding the nines row with near-ten thinking
Nine is close to ten, and that helps
Counting by 9 can be taught as "one less than counting by 10." If three groups of 10 make 30, then three groups of 9 make 27 because one is removed from each group. If six groups of 10 make 60, then six groups of 9 make 54. The chart lets students compare those nearby totals while still seeing the nines sequence directly.
This near-ten idea is especially useful for mental math. Students who know the skip count by 10 chart can use it as a reference point, then adjust down by the number of groups.
The digits tell a visible story
In the early nines pattern, the tens digit climbs while the ones digit falls: 09, 18, 27, 36, 45, 54, 63, 72, 81, and 90. Students often enjoy seeing that staircase, but the pattern should be tied back to addition. Each total is still nine more than the previous total.
The digit sum is another useful observation. Many early multiples of 9 have digits that add to 9. That idea connects later to the divisible by 9 chart, where digit sums become a test for larger numbers.
The number line keeps the row honest
Pattern tricks are helpful, but the number line prevents students from treating nines as magic. The chart shows equal jumps of 9 from one landing point to the next. Moving from 36 to 45 is plus 9. Moving from 72 to 81 is also plus 9. The jump size never changes.
Have students cover the digit pattern and answer using only addition: 45 plus 9 is 54, 54 plus 9 is 63, 63 plus 9 is 72. Then uncover the pattern and compare. This helps both reasoning styles support each other.
Facts can be rebuilt from tens
When a student forgets 8 x 9, they can think of 8 x 10 = 80 and subtract 8 to get 72. This strategy works because each group of nine is one less than each group of ten. The chart gives the final sequence, but the strategy gives students a way to find a missing value without guessing.
It is useful to ask students to explain both paths: count by nines to 72, then solve from tens to 72. When both routes agree, confidence increases.
Moving from sequence to table
For multiplication fact review, the 9 times table chart organizes these same totals by equation. This skip-count chart should stay nearby for students who need the motion of the row before they can recall each product quickly.
Comparing nines with threes
Every multiple of 9 is also a multiple of 3, but the reverse is not always true. That relationship becomes clearer after students know the nines count and have also worked with threes. A quick comparison with the divisible by 3 chart can help older learners see why the 9 rule is stricter.
A useful review routine
Read the sequence once from 9 to 108, then work backward from 90. Backward nines are difficult at first, but they reveal whether students understand the step size. After that, ask for missing values in the middle of the row, such as the number between 54 and 72. The expected answer is 63 because both neighboring jumps are nine apart.
For a final check, mix one near-ten question with one sequence question. A student might solve 7 x 9 by thinking 70 minus 7, then confirm it by landing on 63 in the skip-count row. When both methods meet at the same number, the pattern becomes much easier to trust.