



Fifteen table practice guide
Connecting the 15 table to quarters, fives, and tens
Fifteen can be split into ten and five
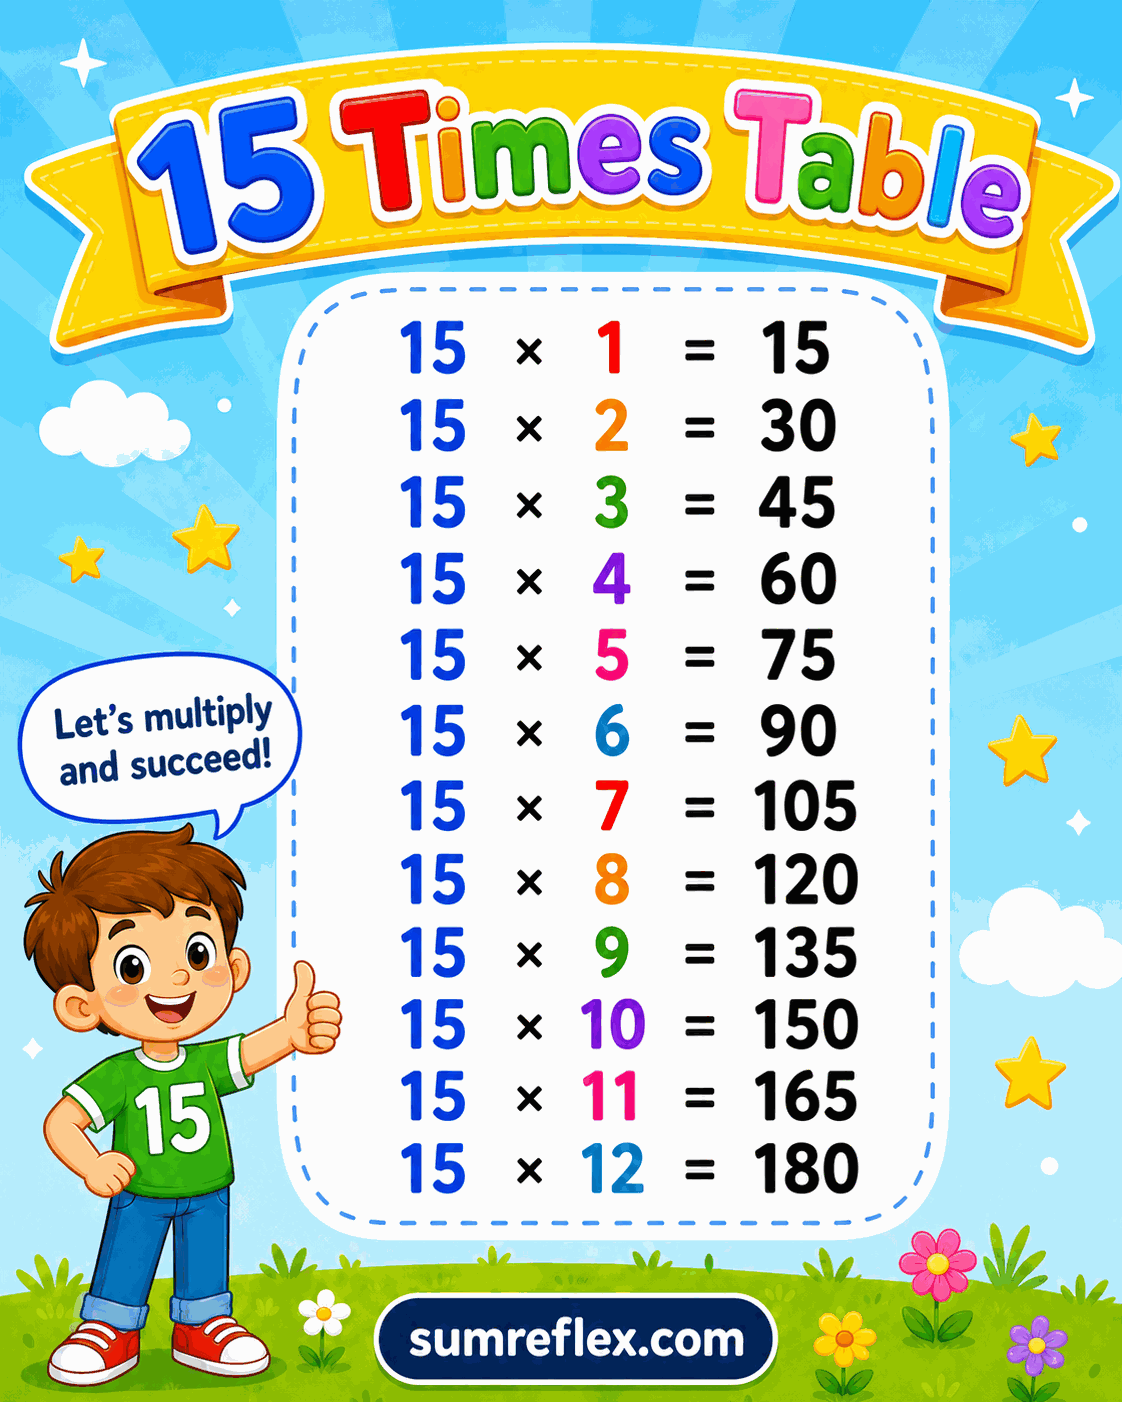
The most dependable strategy for the 15 table is to split 15 into 10 and 5. For 15 x 8, students can calculate 80 and 40, then combine them for 120. For 15 x 12, they can calculate 120 and 60, then combine them for 180. The chart confirms the product after the split is complete.
This method is useful because most students know the 10 table and 5 table earlier than the 15 table. The 5 times table chart can support the second partial product if learners are still building five-based fluency.
Quarter hours make the first products familiar
Counting by 15 appears naturally on a clock: 15 minutes, 30 minutes, 45 minutes, and 60 minutes. Those first four products give students a real-world anchor before the row moves beyond one hour. The chart extends the same count into 75, 90, 105, 120, and larger products.
When the lesson is about time notation, pair this page with the 24-hour clock chart. The clock chart handles time reading, while this table focuses on multiplication by 15.
Endings of 0 and 5 give quick feedback
Every product in the 15 table ends in 0 or 5 because every 15 product is also a multiple of 5. Students can use that fact as a first check. If a product ends in 2, 4, 6, or 8, something is wrong before they even compare with the chart.
The divisible by 5 chart explains that ending rule directly. This multiplication chart shows the same number family created by repeated groups of 15.
Halfway between ten and twenty facts
Another way to reason about 15 is to see it halfway between 10 and 20. Fifteen times 6 should be halfway between 60 and 120, which is 90. Fifteen times 8 should be halfway between 80 and 160, which is 120. This method is more advanced, but it builds strong estimation habits.
Use this comparison for students who already know the 10 and 20 rows. It helps them predict product size before they look at the exact value.
Good practice without overusing the chart
The page works best as a check after students try a strategy. Cover the products, choose a factor, solve with 10 plus 5, and then reveal the answer. If the product is wrong, ask which partial product caused the problem. This keeps correction tied to reasoning.
For mixed review, the 1 to 20 times table chart can come later. This single-table page should stay in use while students are still learning how fifteens are built.
A short real-life prompt
Ask how many minutes are in 7 quarter-hour blocks, then ask how many items are in 7 boxes with 15 items each. The stories are different, but the product is the same: 105. That comparison helps students recognize multiplication structure across contexts.
For another prompt, ask students to compare 15 x 6 with 5 x 18. Both products are 90, but the grouping stories are different. Discussing that difference helps learners see that a product can be reached through more than one factor pair.
When learners get comfortable, ask them to extend the row past the printed facts. After 15 x 12 = 180, the next few products are 195, 210, and 225. Extending the row proves that the pattern is a repeatable rule, not a fixed list that stops at the edge of the chart.
That keeps practice flexible.