



Six table support guide
Building the 6 table from smaller facts students already know
Six has more than one useful doorway
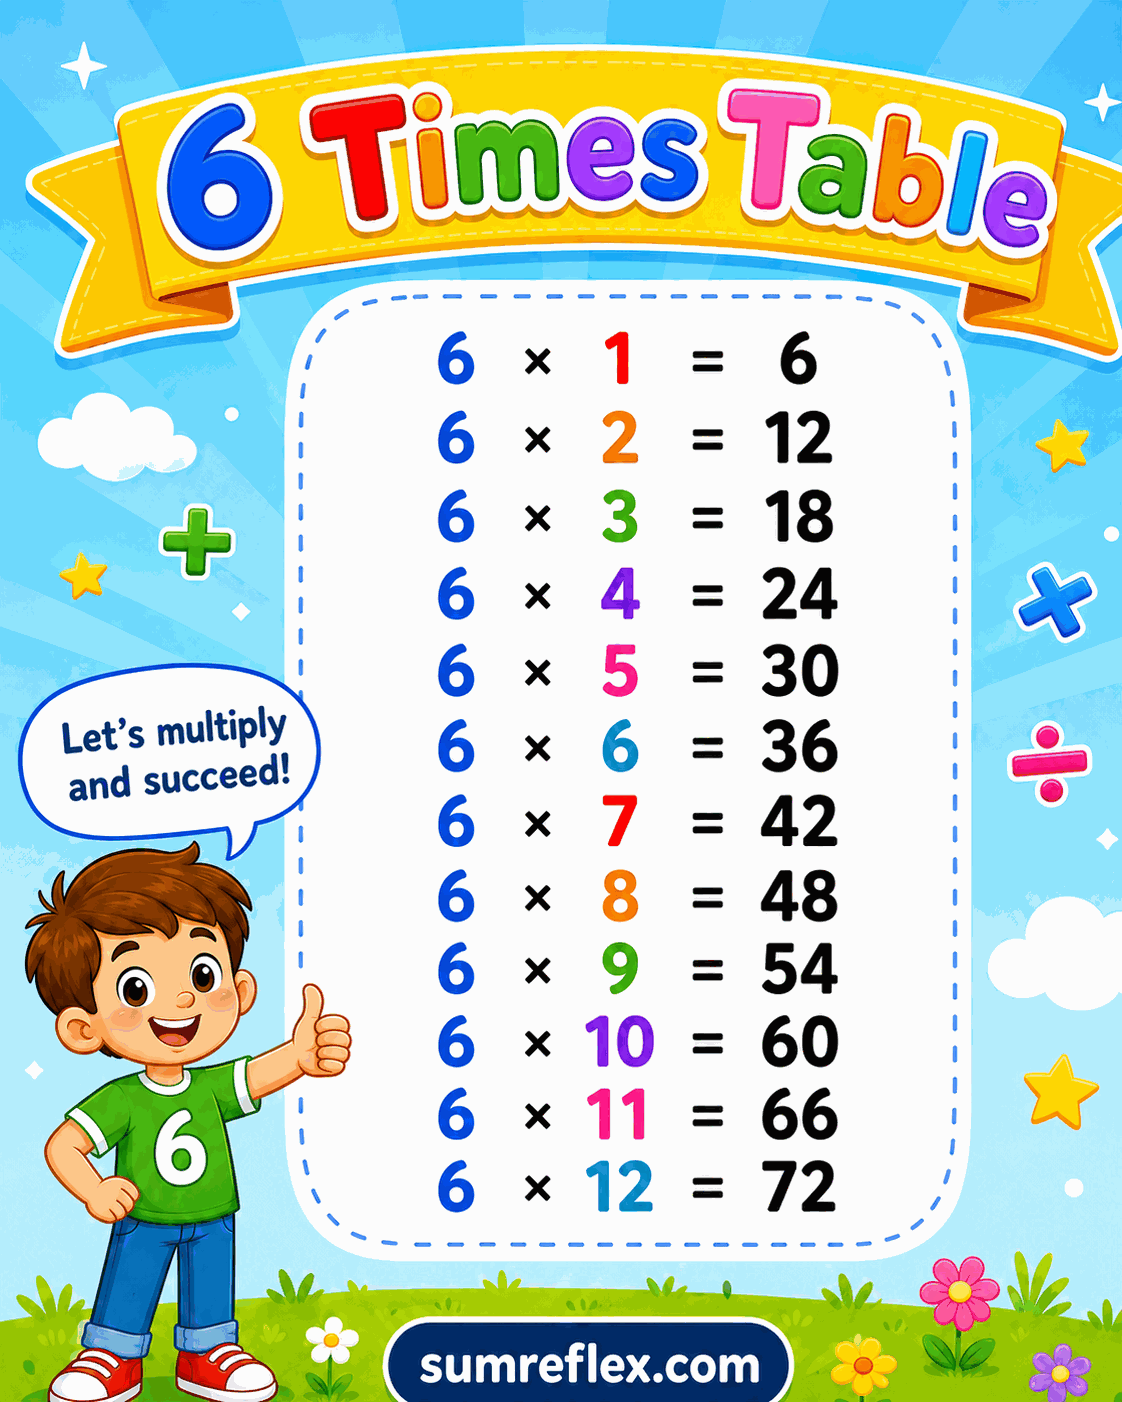
The 6 table can be built in several ways. Six is double 3, so 6 x 8 can be found by doubling 3 x 8. Six is also 5 plus 1, so 6 x 8 can be found by taking 5 x 8 and adding one more group of 8. The chart gives the product, but these pathways help students reach it.
This flexibility is important because different learners remember different supporting rows. Some students trust the 3 table. Others are faster with fives. The page should allow either route as long as the explanation is clear.
Doubled threes make the row less heavy
If a student knows 3 x 7 = 21, then 6 x 7 is double 21, or 42. This is a strong strategy because it uses a smaller row and a doubling step. The 3 times table chart can support the first half of that work.
Ask students to write the matching 3 fact beside a few 6 facts. The side-by-side comparison makes the relationship visible and helps the 6 row feel less random.
Five plus one catches common mistakes
Many mistakes in the 6 row are actually 5 table answers. A student may say 6 x 8 is 40 because 5 x 8 is 40. Instead of only correcting the answer, show that one more group of 8 is needed. Forty plus 8 gives 48.
This correction turns an error into a strategy. The student sees exactly what was missing, and the chart confirms the completed product.
Target the facts that cause hesitation
The entire 6 row does not need equal practice. Facts such as 6 x 1, 6 x 2, 6 x 5, and 6 x 10 are usually easier. Facts such as 6 x 6, 6 x 7, 6 x 8, and 6 x 9 often need more attention. Use the chart to identify the difficult section and practice that section deliberately.
A short card routine works well: solve, explain the strategy, check the chart, and repeat only the missed facts. This saves time and keeps practice focused.
Skip counting can support but not replace facts
Counting by sixes helps students hear the sequence, especially when they are first learning the row. The skip count by 6 chart is useful for that movement. This times-table chart is for matching each product to a factor pair.
Ask students to start from an anchor such as 30 or 36 instead of beginning at 6 every time. That flexible movement shows stronger understanding than reciting the whole row from the start.
Where six connects to divisibility
Older students can connect this row to the divisible by 6 chart. Multiplication lists the early multiples of 6, while the divisibility rule checks whether a larger number belongs to that same family. This link helps students see why factor rules matter.
For daily practice, choose one 6 fact and require two explanations. Six times 8 can be 48 because 3 x 8 is 24 and 24 doubled is 48; it can also be 5 x 8 plus one more 8. Two explanations reduce guessing and help students choose a method that fits the fact.
The chart should confirm the result after the reasoning, not replace the reasoning. That order keeps the row from becoming another set of unsupported answers.
For a quick extension, ask students to compare 6 x 9 and 9 x 6 on the chart. The product is the same, but the group story can be different. That comparison strengthens factor-order understanding while the 6 row is being reviewed.