



Three table practice guide
Teaching the 3 table with groups, rhythm, and nearby facts
Groups of three need a clear story
The 3 table becomes easier when every fact has a meaning. Three sides on each triangle, three counters in each cup, three points per turn, or three rows of objects can all become multiplication stories. The chart gives the product row, but examples give the facts a reason to exist.
Ask students to build or draw a few groups before they read the facts. Three groups of four, four groups of three, and twelve total objects should all be discussed together. That conversation helps students see factor order and product as connected ideas.
Rhythm is helpful when it stays connected to quantity
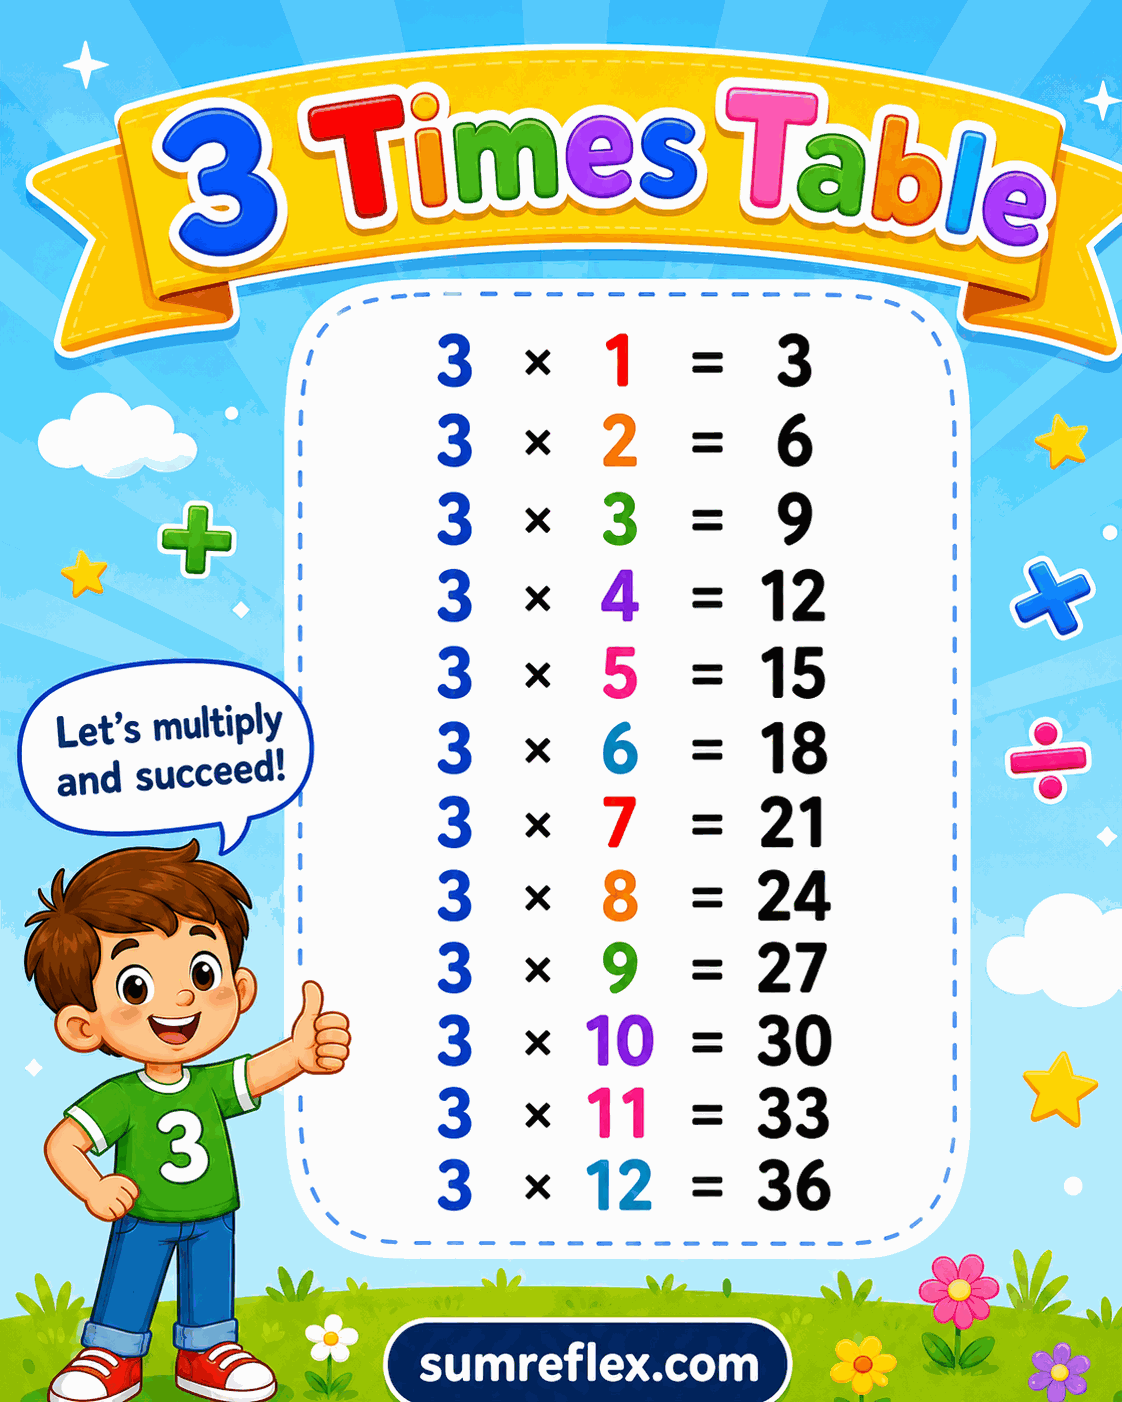
The threes row has a natural sound: 3, 6, 9, 12, 15, 18. Saying the row aloud can support memory, but students should not rely only on the chant. The chant needs to be attached to multiplication facts such as 3 x 6 = 18 and 3 x 9 = 27.
The skip count by 3 chart is useful when the sequence itself needs practice. This times-table page is the better tool when students are ready to connect each landing to a factor pair.
Start from an anchor instead of the beginning
Students often recite from 3 every time, even when they need only one fact. Encourage anchor thinking. If 3 x 5 is 15, then 3 x 6 is 18 and 3 x 7 is 21. If 3 x 10 is 30, then 3 x 9 is 27. The chart helps students see products before and after an anchor.
This is a stronger habit than restarting the entire row. It also prepares students for division and missing-factor questions, where they must move around inside the row rather than always begin at the first product.
Arrays keep the row from becoming a song only
Draw arrays with three in each row or three rows of a chosen number. The visual model lets students count totals, compare factor order, and check a product. For 3 x 8, a student can show three rows of eight or eight rows of three. Both arrays contain 24 objects.
This drawing task is especially useful for students who can chant the row but cannot explain what the facts mean. The chart confirms the product after the array has done the teaching.
The divisibility rule comes later
Older students may learn that multiples of 3 can be checked by adding digits. That belongs with the divisible by 3 chart. This 3 times table page should come first because it builds the early products from equal groups.
When both pages are used together, make the direction clear. Multiplication creates the multiples. Divisibility tests whether a number belongs to that multiple family.
A short review plan
Choose four facts from the row: one easy, one middle, one hard, and one reverse question. A reverse question might show 24 and ask which 3 fact created it. This small set gives better information than asking students to recite everything in order.
For a practical variation, connect the selected facts to triangles. If one triangle has three sides, then 8 triangles have 24 sides. The story is simple, but it gives the product a reason. Students who can move between story, fact, and product are using the 3 table more deeply than students who only chant the row.