



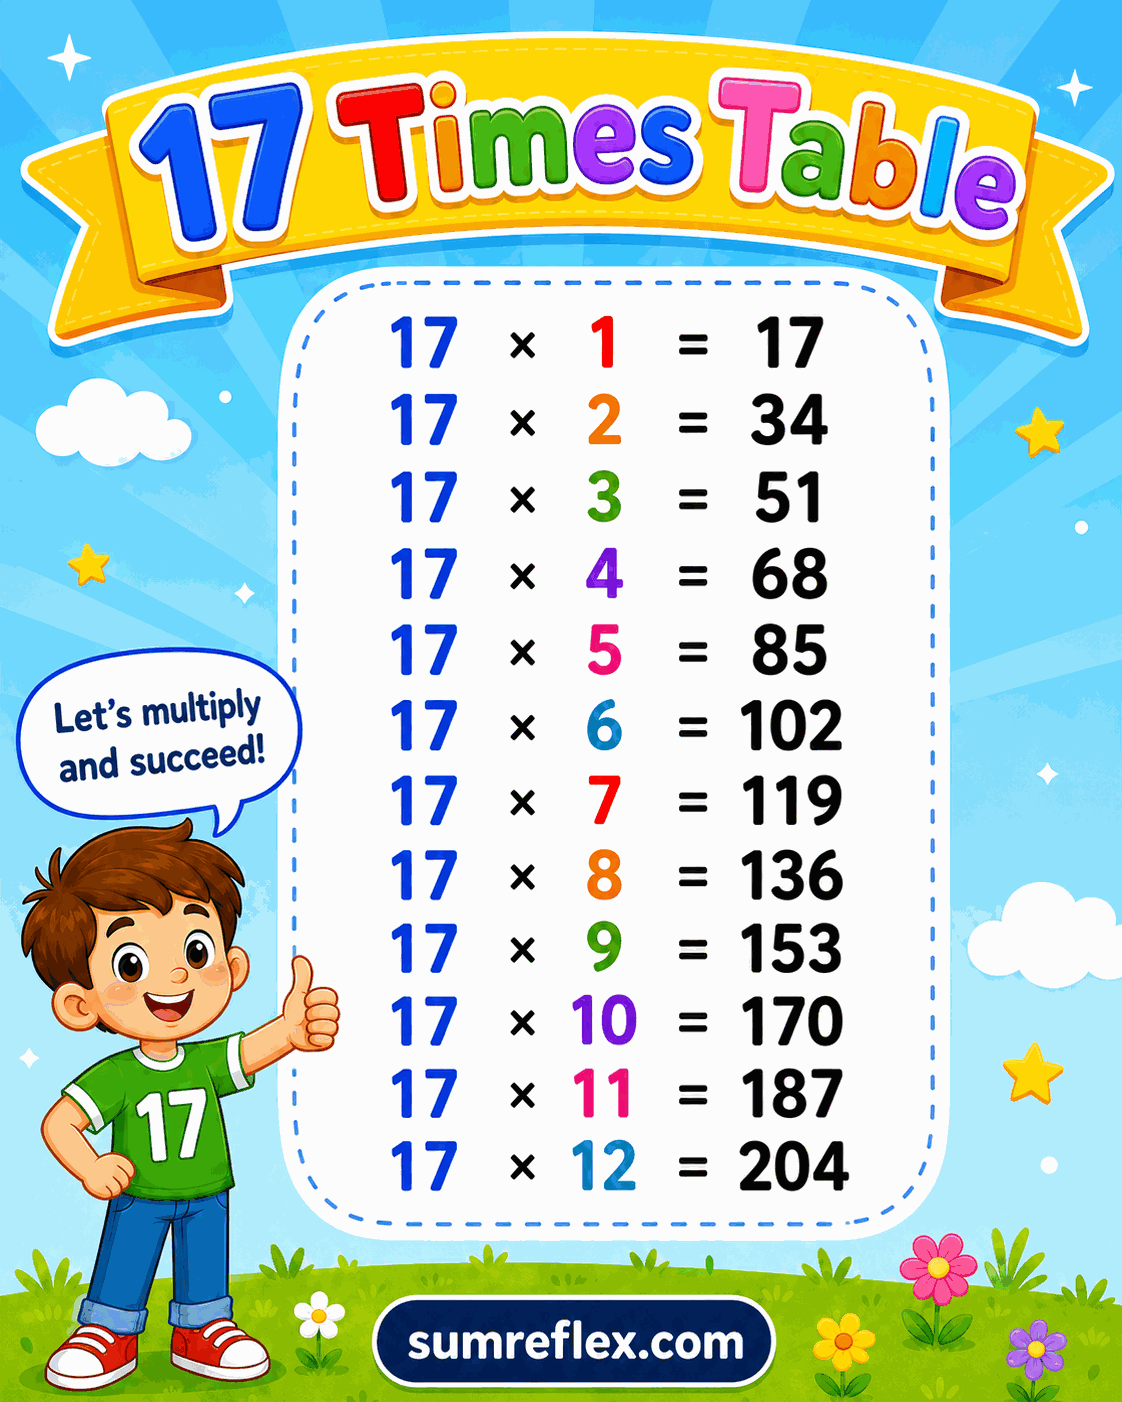
Seventeen table accuracy guide
Approaching the 17 table with structure instead of guessing
Seventeen does not give many shortcuts
Some multiplication rows offer obvious hooks. The 10 row has place value, the 11 row has an early repeated-digit pattern, and the 15 row connects to quarter hours. The 17 row is quieter. That makes it a good table for teaching students to rely on structure when a row does not feel friendly.
The chart should be used after an attempt, not as the first move. Students can estimate, split, add partial products, and then check the listed product. This keeps the page active and prevents copying.
Ten plus seven gives a dependable build
The most useful split is 17 = 10 + 7. For 17 x 8, students find 80 and 56, then add them to get 136. For 17 x 12, they find 120 and 84, then combine them for 204. The same method works across the row, even when the product is large.
This strategy makes the 7 times table chart a helpful support. If the seven-part is slow, students can review that row first and then return to the 17 chart.
Use nearby benchmarks before exact work
Before calculating a 17 fact, students should ask what a reasonable answer would look like. Seventeen times 6 should be greater than 15 x 6, which is 90, and less than 20 x 6, which is 120. The exact answer, 102, fits between those benchmarks.
This estimate is not busywork. It helps catch errors such as adding partial products incorrectly or dropping a digit. If a final answer sits outside the expected range, the student should redo the split before checking the chart.
Prime-number status explains the lack of a smaller row
Seventeen is prime, so the row is not a simple doubled or tripled version of a smaller table. That is one reason the products may feel less familiar. Students who are learning factor language can connect this to the prime and composite numbers chart.
This observation should not make the row intimidating. It simply tells students which kind of support to use. For 17, decomposition into 10 and 7 is more practical than looking for a hidden doubled table.
A slow routine that builds memory
Choose one fact and write the two pieces every time. For 17 x 9, write 90 and 63, then add 153. For 17 x 11, write 110 and 77, then add 187. Repeated building gradually creates memory because students keep seeing the same products after they have produced them.
When the row becomes familiar, move to mixed review with the 1 to 20 times table chart. Until then, this single-table printable gives enough space for careful work.
A useful teacher check
Ask students to explain one correct answer and one corrected mistake. The corrected mistake is valuable because it shows whether they understand the split. If they can say, "I added 80 and 56 incorrectly, so 17 x 8 should be 136," the chart has supported reasoning rather than answer copying.
This page is also useful for comparing nearby products. Seventeen times 9 is 153, and seventeen times 10 is 170, so the row rises by 17 each time. Asking what comes before or after a product helps students use the constant step, not just the split strategy.
That constant-step idea is especially helpful when students must fill missing products in the middle of the row.