



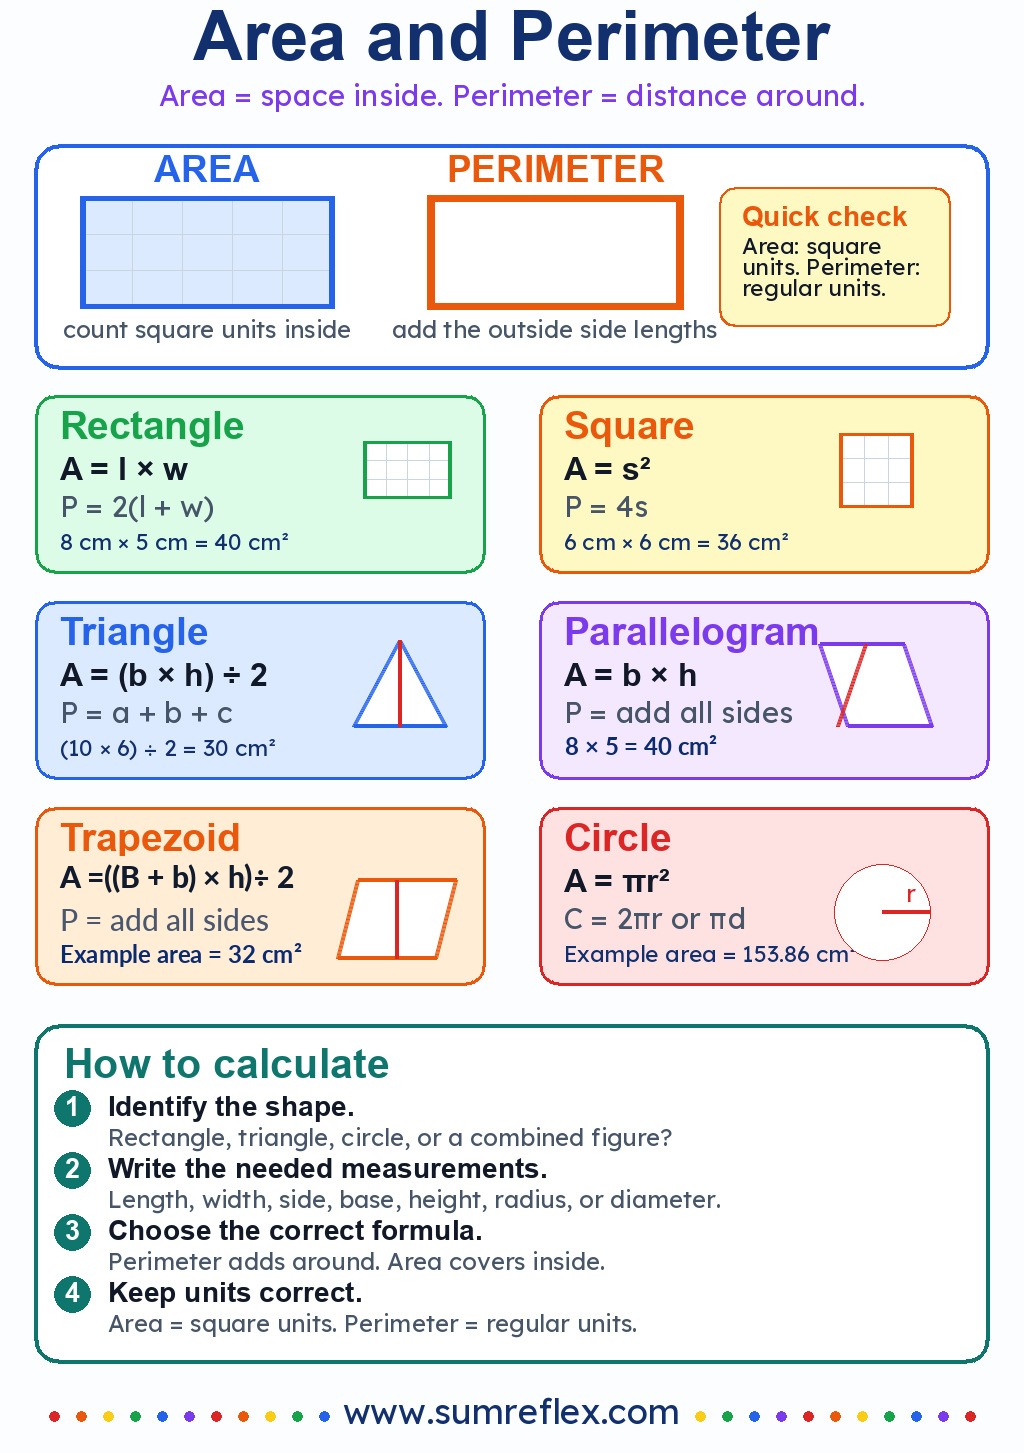
Area and perimeter study guide
Helping students decide what a geometry question is really asking
Choose the measurement before choosing the formula
Many wrong answers in early geometry begin before any arithmetic happens. A student sees a rectangle, remembers a formula, and starts calculating without deciding whether the problem asks for the inside or the border. This chart puts that decision first. Area describes the amount of flat space a shape covers. Perimeter describes the total distance around the outside edge. Once students can say that difference in their own words, the formulas become easier to use with purpose.
The printable is especially useful when area and perimeter appear together on mixed worksheets. Instead of scanning for numbers and guessing, students can pause at the chart and ask, "Am I covering the shape or walking around it?" That question is simple, but it changes the habit. It turns formula selection into reading comprehension, not memory alone.
How the chart changes word-problem habits
Area problems often use words such as cover, tile, paint, carpet, space, surface, or floor. Perimeter problems often use fence, border, frame, trim, edge, path, or distance around. The chart can sit beside a notebook while students underline those clue words. The goal is not to make clue words a trick; the goal is to help students connect everyday language to the measurement being requested.
For a room problem, "How much carpet is needed?" points to area because the floor must be covered. "How much baseboard trim is needed?" points to perimeter because the trim follows the walls. Asking students to draw a tiny sketch beside each word problem can make the choice even clearer. Shade the inside for area. Trace the outline for perimeter. That small visual action often fixes confusion faster than repeating definitions.
Unit labels that catch quiet mistakes
Units are more than decoration at the end of a solution. They tell whether the answer matches the measurement. Area uses square units because the shape is counted in unit squares. Perimeter uses ordinary length units because only the outside distance is measured. A rectangle might have an area of 48 square centimeters and a perimeter of 28 centimeters; the numbers are different, but the unit labels are what reveal the type of answer.
When students are comparing both values for the same figure, ask them to circle the unit label before checking the number. If the answer for perimeter is written with square units, the process needs a second look. If an area answer is missing the square label, the calculation may be correct but the mathematical statement is incomplete.
A useful path after the printable
This chart gives the overview. When students need a deeper focus on one shape, the perimeter of a rectangle chart narrows the topic to length, width, and equivalent perimeter formulas. When they are ready to check more varied shape calculations, the area calculation table chart shows worked examples with substitutions and final square-unit answers.
The Area Calculator can also be used after paper practice to verify a result, but students should still identify the shape and formula first. The strongest workflow is chart, written setup, calculation, then calculator check. That order keeps the technology from replacing the geometry thinking.
What to ask while students compare shapes
A good review conversation does not need many problems. Give students two rectangles with the same area but different perimeters, then ask why the outside distance changed. Give two shapes with the same perimeter but different areas, then ask which one covers more space. Those comparisons help learners see that area and perimeter are related by shape, not by a fixed rule.
Keep the printable visible during these discussions. Students can point to the formulas, but they should also explain what the formulas measure. That explanation is the real sign that the chart has done its job.