



Worked area examples
Using an area table to connect formulas with finished calculations
Why worked rows matter
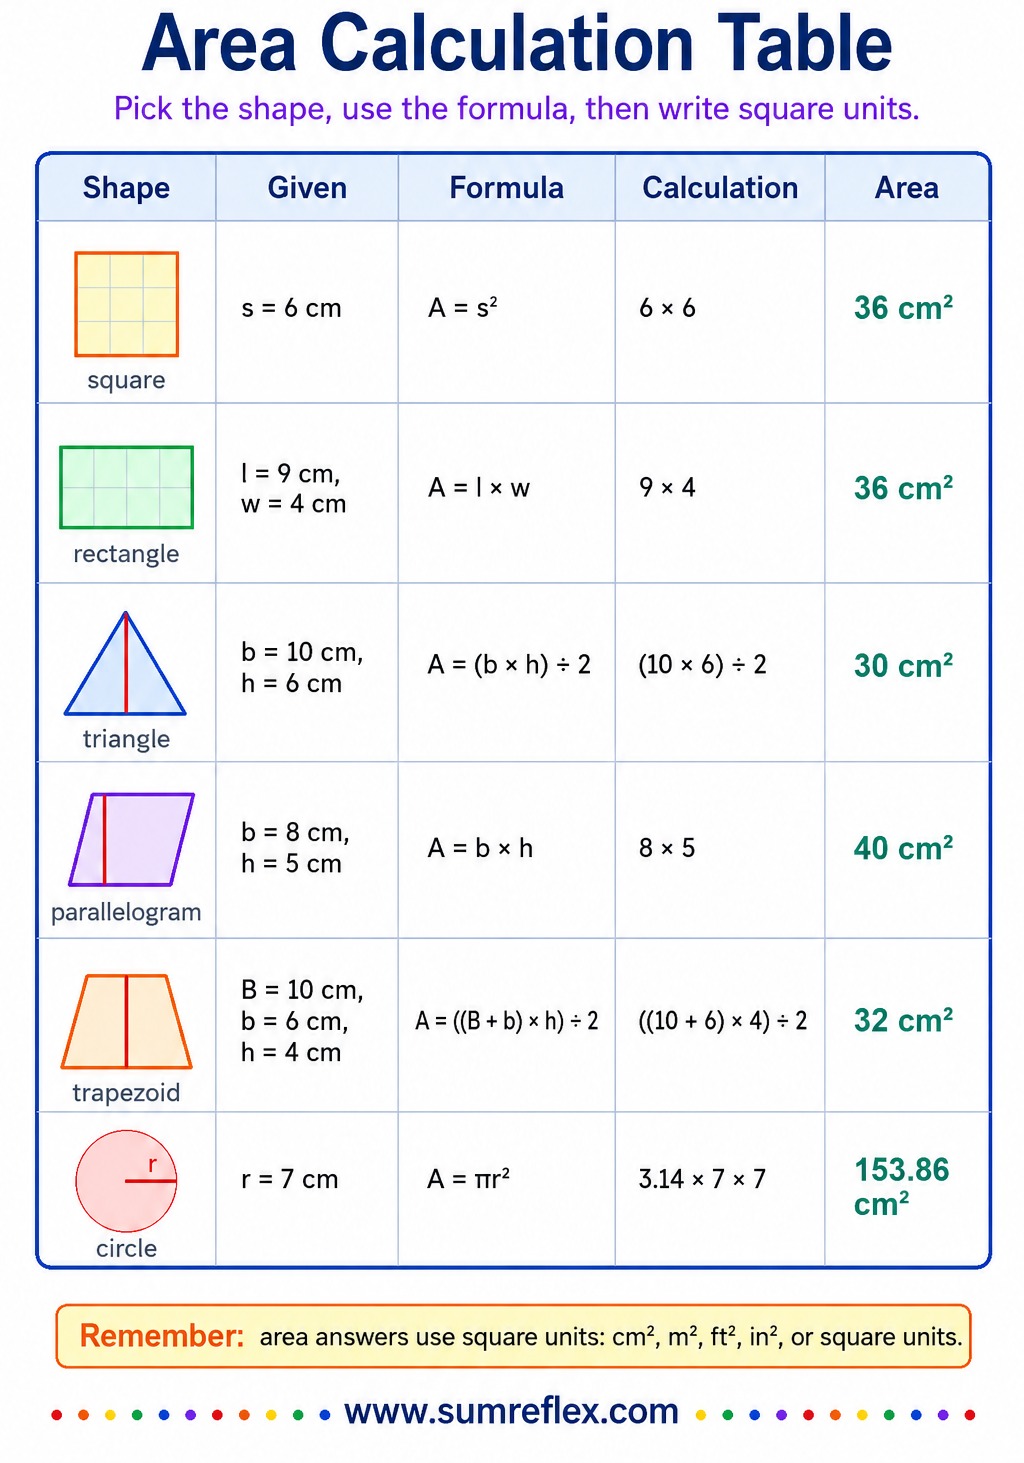
A formula chart tells students what to use, but a calculation table shows where each number belongs. That difference matters. Learners may know that the area of a triangle is one half times base times height, yet still hesitate when the base and height are given in a diagram. This printable fills the gap by lining up the shape, the given measurements, the formula, the substitution, and the final answer in one row.
The row format also makes comparison easier. A square and a rectangle use closely related ideas, while a triangle adds the half step. A parallelogram may look slanted, but its area still depends on base and vertical height. A trapezoid requires the two parallel bases before multiplying by height. A circle changes the conversation again because the radius becomes the key measurement. Seeing those differences side by side helps students stop treating every area problem as the same multiplication task.
Cover, solve, reveal
One practical way to use the chart is to cover the calculation and answer columns with a strip of paper. Students look only at the shape, dimensions, and formula. They write their own substitution, complete the arithmetic, and then uncover the row to compare. That routine keeps the chart active. It becomes a self-checking model rather than a page students copy without thinking.
For tutoring, choose one row at a time and ask the learner to explain why each number was placed where it was. In the triangle row, why is the height not the slanted side? In the circle row, why does diameter need different handling from radius? Those spoken explanations reveal whether the student is following the structure or only matching surface details.
What each shape teaches differently
The table is compact, but each row carries a different teaching point. The square row reinforces equal side lengths. The rectangle row shows length times width. The triangle row highlights the relationship between a rectangle or parallelogram and half the space. The parallelogram row separates side length from vertical height. The trapezoid row asks students to combine the two bases before multiplying by height. The circle row introduces a curved boundary and a radius-based formula.
Those distinctions are why this chart pairs well with the broader area and perimeter chart. The broader page helps students decide what kind of measurement they need. This table then shows how area work is carried out once the choice has been made.
Moving from examples to independent area work
After students study the table, give them a blank version with the formula column filled but the calculation column empty. Later, remove the formula column too. That gradual fading helps students internalize the process without pulling the support away too quickly. The chart can stay nearby as a reference while the work becomes less guided.
When students finish an independent problem, they can compare their setup with the closest row on the chart. The exact numbers may differ, but the structure should match. For digital checking after the written setup is complete, the Area Calculator gives a quick confirmation. The important habit is to enter values only after the correct shape and measurement have been identified on paper.