What Grade 7 data and statistics covers
Data and statistics lessons help students organize information, count repeated values, compare categories, read charts, and use numbers to describe a group.
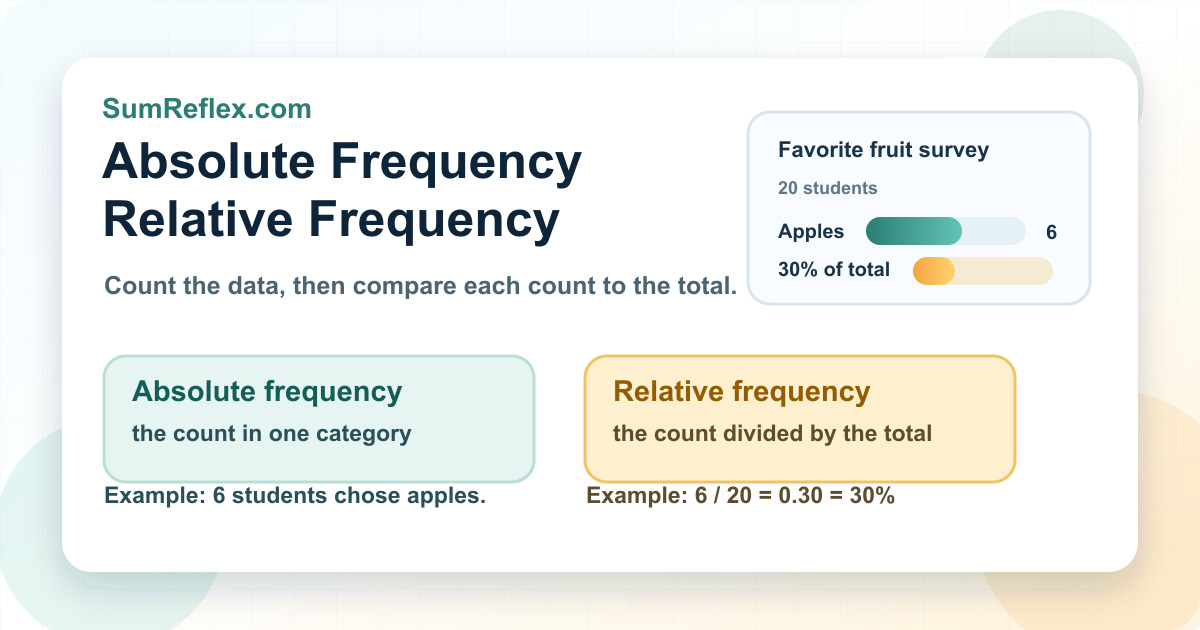
Why frequency matters
A frequency table turns a long list of data into a clear summary. Once the counts are organized, students can compare the size of each category using fractions, decimals, and percentages.
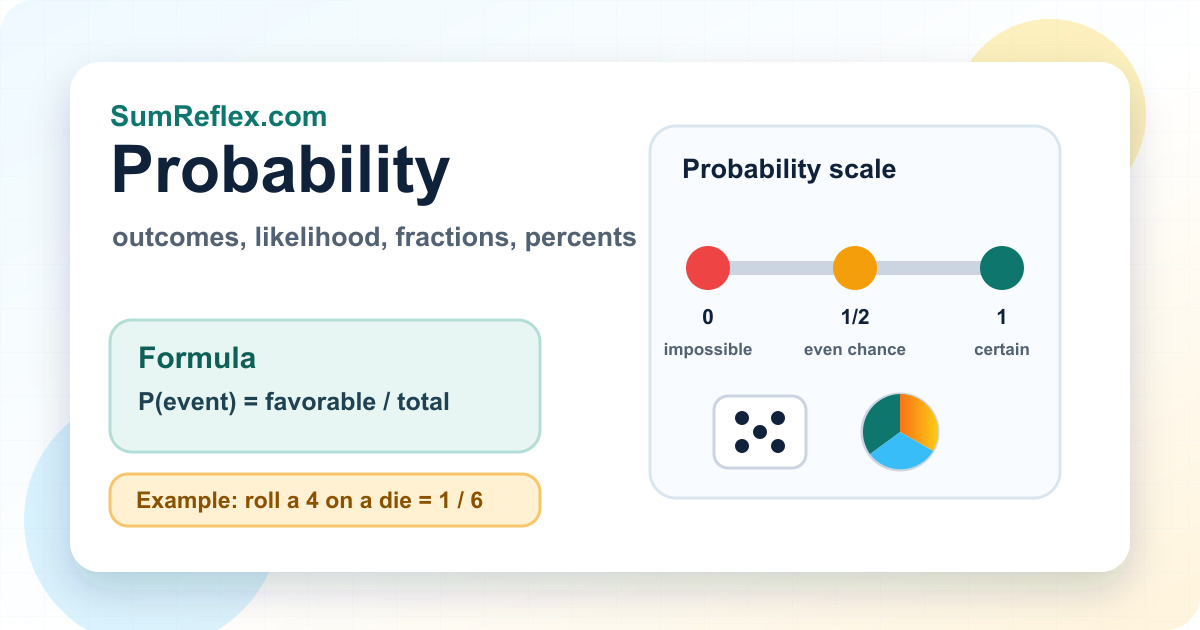
Why probability belongs with data
Probability uses outcomes, experiments, trials, and relative frequency. Students can compare the chance they expect with what actually happens in repeated trials.
Start with counts, then compare to the total
Most frequency work follows the same path: count each value, find the total, divide each count by the total, and check that the relative frequencies make sense.