



Grade 11 statistics lesson
Binomial Distributions: Formula, Chart, Examples, and Practice
A binomial distribution models the number of successes in a fixed set of independent trials with the same chance of success each time.
What is a binomial distribution?
A binomial distribution describes the number of successes in a fixed number of repeated trials.
Each trial has only two outcomes for the question being asked: success or failure. Success does not have to mean something good. It simply means the result you are counting.
Example: If a basketball player takes 8 free throws and the chance of making each shot is 0.75, the random variable can be the number of made shots out of 8.
When a situation is binomial
Use a binomial distribution only when four conditions are true.
Fixed trials: the number of trials is set before the experiment starts.
Two outcomes: each trial is counted as success or failure.
Same probability: the chance of success, written \(p\), stays the same on every trial.
Independent trials: one trial does not change the chance on another trial.
Binomial distribution formula
If \(X\) is the number of successes, the exact probability of getting \(k\) successes is:
\[P(X=k)=\binom{n}{k}p^k(1-p)^{n-k}\]
In the formula, \(n\) is the number of trials, \(k\) is the number of successes, \(p\) is the probability of success, and \(1-p\) is the probability of failure.
The combination \(\binom{n}{k}\) counts how many different ways the \(k\) successes can be arranged among the \(n\) trials.
Binomial distributions reference chart
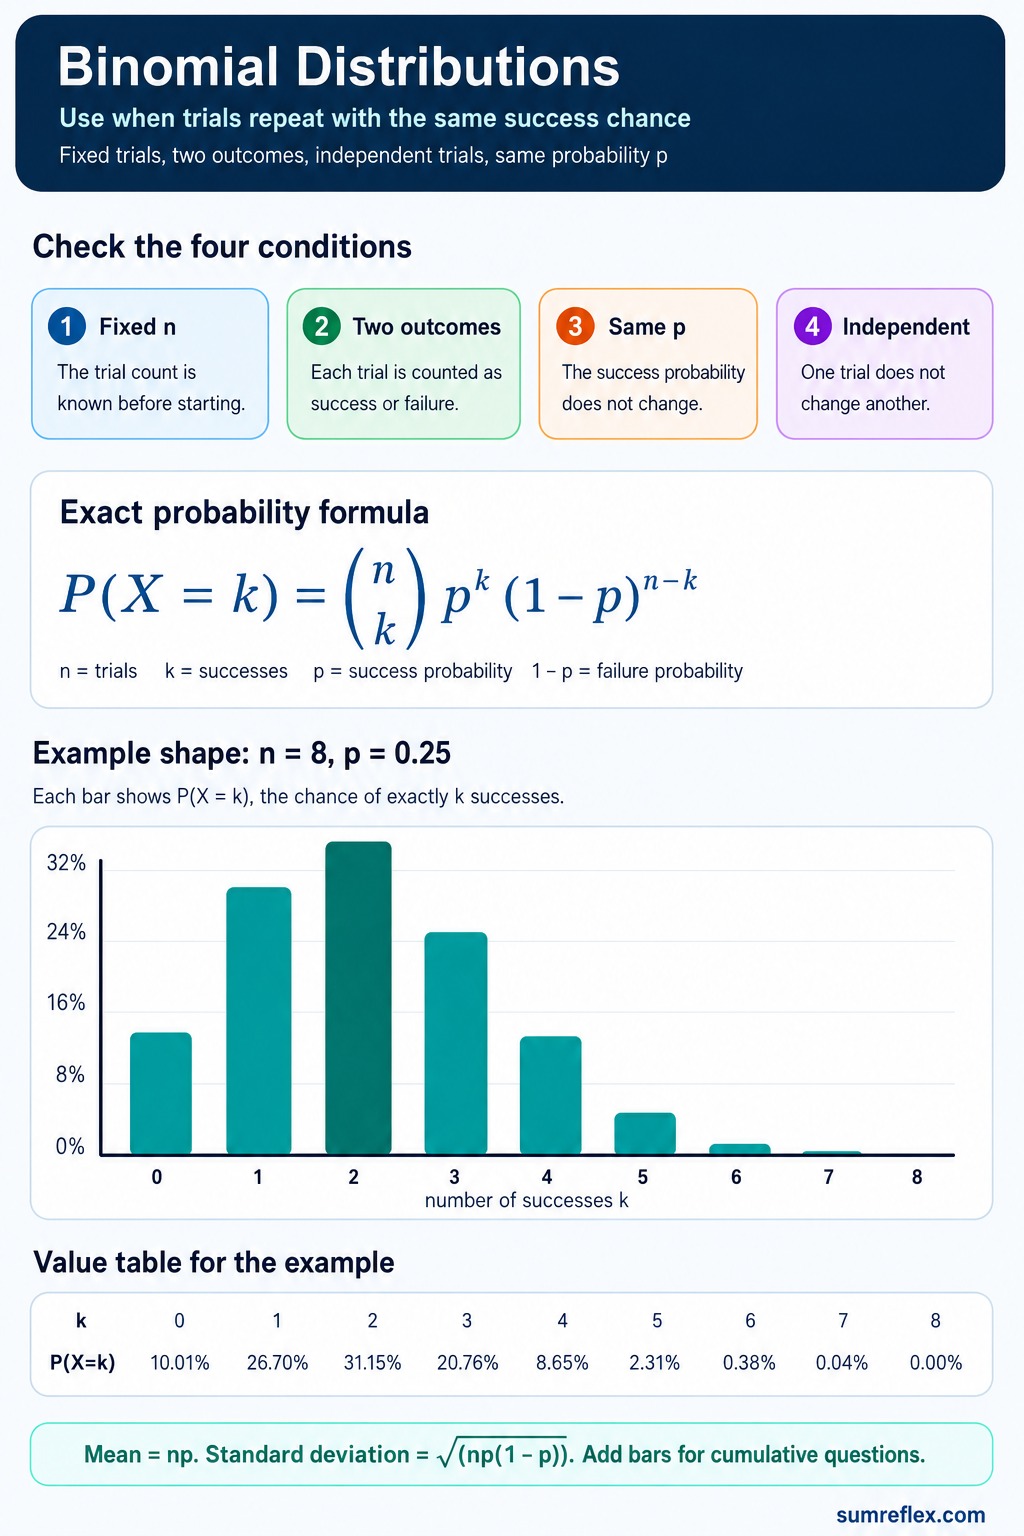
Use this chart as a quick way to connect the formula, the conditions, and the shape of a binomial distribution.
The example chart uses \(n=8\) trials and \(p=0.25\). The tallest bar is near \(k=2\) because the expected number of successes is \(np=8(0.25)=2\).
How to read the chart
The horizontal axis shows the possible number of successes. In the chart example, \(k\) can be 0, 1, 2, 3, 4, 5, 6, 7, or 8.
The height of each bar shows \(P(X=k)\), the probability of exactly that many successes.
A single bar answers an exact probability question. Several bars added together answer an at-most, at-least, less-than, or greater-than question.
Those added-up probabilities are cumulative probabilities. The related cumulative distribution function lesson explains how \(F(x)=P(X\le x)\) works for binomial and other distributions.
Example 1: exactly 2 successes
Problem: A quiz has 8 true-or-false questions. A student guesses randomly. What is the probability of exactly 2 correct answers?
Here \(n=8\), \(p=0.5\), and \(k=2\).
\[P(X=2)=\binom{8}{2}(0.5)^2(0.5)^6\]
\[\binom{8}{2}=28\]
\[P(X=2)=28(0.5)^8=0.109375\]
Answer: The probability of exactly 2 correct guesses is \(0.109375\), or about \(10.94\%\).
Example 2: at least 4 successes
Problem: A machine passes a quality check with probability 0.60 on each independent run. If it is tested 5 times, what is the probability it passes at least 4 times?
At least 4 means \(X=4\) or \(X=5\).
\[P(X\ge 4)=P(X=4)+P(X=5)\]
\[P(X=4)=\binom{5}{4}(0.6)^4(0.4)^1=0.2592\]
\[P(X=5)=\binom{5}{5}(0.6)^5(0.4)^0=0.07776\]
\[P(X\ge 4)=0.2592+0.07776=0.33696\]
Answer: The probability is \(0.33696\), or about \(33.70\%\).
Mean and standard deviation
A binomial distribution also has a center and spread.
The mean, or expected number of successes, is \(\mu=np\).
The standard deviation is \(\sigma=\sqrt{np(1-p)}\).
For the chart example with \(n=8\) and \(p=0.25\), the mean is \(8(0.25)=2\), and the standard deviation is \(\sqrt{8(0.25)(0.75)}\), which is about \(1.225\).
When not to use a binomial distribution
Do not use a binomial model just because a problem repeats something.
If the probability changes after each draw, as in drawing cards without replacement, the trials are not independent in the binomial sense.
If there are more than two categories being counted at the same time, the problem may need a different distribution.
If the number of trials is not fixed before the experiment starts, check whether the question is really asking for a different model.
If the question counts events in a fixed interval from an average rate, the Poisson distribution lesson may be the better match.
Calculator connection
For quick checks, use the Probability Calculator and choose the Binomial distribution mode.
Enter \(n\), \(p\), and \(k\), then choose whether the question asks for exactly, at most, at least, less than, or greater than \(k\) successes.
If the hard part is counting arrangements before using probability, the Permutation and Combination Calculator can help with \(\binom{n}{k}\).
Common mistakes
Do not use \(p\) for failure unless the problem defines success that way. Usually \(p\) is the success probability and \(1-p\) is the failure probability.
Do not forget the combination part. The formula needs \(\binom{n}{k}\) because the successes can appear in different positions.
Do not treat "at least" as one exact value. At least 4 includes 4, 5, 6, and so on up to \(n\).
Do not round too early. Keep several decimal places until the final answer.
Quick practice
1. A fair coin is flipped 6 times. What are \(n\) and \(p\) if success means heads? Answer: \(n=6\), \(p=0.5\).
2. A seed sprouts with probability 0.80. In 4 independent plantings, write the expression for exactly 3 sprouts. Answer: \(\binom{4}{3}(0.8)^3(0.2)^1\).
3. In a binomial setting with \(n=10\) and \(p=0.30\), what is the mean? Answer: \(np=3\).
4. In the same setting, what does \(P(X\le2)\) mean? Answer: the probability of 0, 1, or 2 successes.