



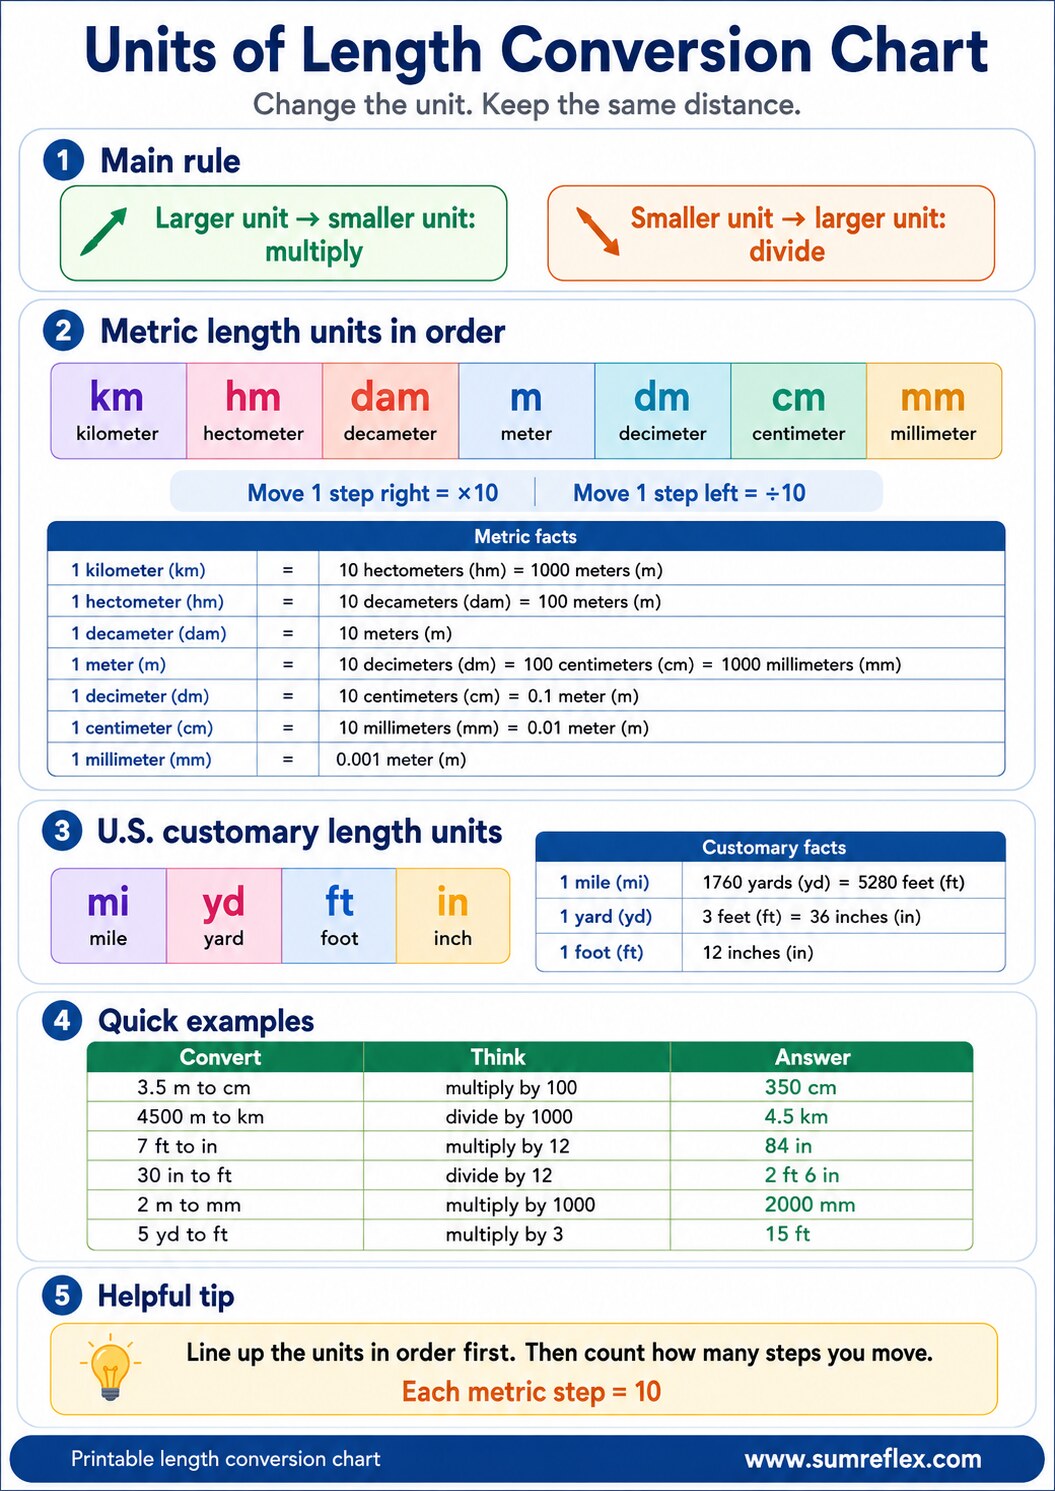
Length conversion guide
Changing the unit while keeping the distance the same
Conversion is a rewrite, not a new measurement
A length conversion does not change the object or distance. It changes the unit used to describe it. A desk that is 120 centimeters long is still the same desk when written as 1.2 meters. A ribbon that is 36 inches long is still the same ribbon when written as 3 feet. This chart helps students keep that idea in mind before they start moving numbers.
That distinction prevents a common error: treating conversion as if the answer should simply be bigger or smaller without context. The number may grow when changing to a smaller unit, and it may shrink when changing to a larger unit. The physical distance stays fixed. The unit size determines what happens to the number.
The metric ladder rewards step counting
Metric length conversions are organized around powers of ten. Kilometer, hectometer, decameter, meter, decimeter, centimeter, and millimeter sit in a steady order. Moving one step toward a smaller unit multiplies by 10. Moving one step toward a larger unit divides by 10. Because the pattern is regular, students can count steps and move the decimal carefully.
For example, meters to centimeters moves two steps toward smaller units, so 3.4 meters becomes 340 centimeters. Centimeters to meters moves two steps toward larger units, so 275 centimeters becomes 2.75 meters. The chart is useful because it shows both direction and distance between units. Students should mark the starting unit and ending unit before moving any decimal point.
Customary conversions need named facts
U.S. customary length units do not follow a single base-ten ladder. Students need named facts: 12 inches equal 1 foot, 3 feet equal 1 yard, 1,760 yards equal 1 mile, and 5,280 feet equal 1 mile. Because the jumps are not uniform, the chart should be used like a fact map. Students identify the relationship they need, then multiply or divide based on the direction.
A useful classroom comparison is 4 yards to feet versus 4 feet to inches. Both conversions move to a smaller unit, so both multiply, but the factors are different. Yards to feet uses 3. Feet to inches uses 12. The chart keeps those facts separate so students do not apply the metric pattern where it does not belong.
Direction language prevents many wrong answers
Before solving, students should say whether they are changing to a smaller unit or a larger unit. Larger unit to smaller unit means more units are needed, so the number increases. Smaller unit to larger unit means fewer units are needed, so the number decreases. That statement gives them a way to estimate whether the answer makes sense.
If 2 meters is converted to centimeters, the answer should be larger than 2 because centimeters are smaller pieces. If 250 centimeters is converted to meters, the answer should be smaller than 250 because meters are larger units. This reasonableness check is often the fastest way to catch a reversed operation.
How this chart connects to measuring and calculators
Use this conversion page after students know which unit belongs to the measurement. The units for measuring length chart helps them choose a sensible unit for an object or distance. This page helps them rewrite that measurement in another unit when a problem asks for it.
For checking more complicated conversions, the Conversion Calculator can confirm a result after the written setup is complete. The printed chart should still be used for the reasoning step: identify the starting unit, identify the target unit, choose the correct fact or metric step count, and decide whether the number should grow or shrink.